Announcing General Availability of NGINX Amplify

Have you been using NGINX, but still don’t have real insights into its performance? Ever wonder whether a configuration snippet copied from somewhere is a valid one? Did you ever have issues with SSL configuration in NGINX? Do you want to make NGINX run even better? Or maybe you’ve just been looking around for the simplest and quickest way to set up cloud monitoring for your LEMP stack? (Where the “E” in “LEMP” stems from “eNGINe‑X” ?)
A little over a year ago, we announced the public beta of NGINX Amplify – our own specialized, free monitoring tool for NGINX and NGINX Plus.
Today, we’re super excited to be removing the beta status for Amplify – it’s now generally available (GA) for NGINX and NGINX Plus users. Amplify is production‑ready, supported, and has a free‑tier monitoring plan. Existing beta users – anyone who signed up prior to today – will have no interruption, and all data will be preserved. Existing features in the free‑tier plan will continue to be provided at no charge. New users will have up to five free hosts to monitor with Amplify.
It’s 2017, and there are plenty of monitoring options out there, ranging from general‑purpose APM product suites to the most esoteric infrastructure monitoring tools. Some of these solutions are free, open source, and do‑it‑yourself. Some are paid, and a lot of them are heavyweight – and some are expensive. Surprisingly, setting up monitoring for a Linux server running NGINX and PHP‑FPM can still be a tedious task, especially for someone who’s just starting with web development and NGINX.
NGINX gained its popularity by being a lightweight and versatile solution for accelerating and securing modern web stacks. A similarly lightweight and versatile monitoring tool for NGINX seemed to be a good idea, and that’s why we’ve created Amplify.
In fact, Amplify has started with the user community for the open source NGINX software as the focus. We’re committed to making our open source products useful and powerful at all levels. Our experience with Amplify so far has demonstrated great success in adding to the power of NGINX.
Amplify is all about “NGINX monitoring made easy” and monitoring NGINX everywhere, whether your deployment is on-prem or in the cloud. Amplify is also an unprecedentedly low‑barrier approach to NGINX monitoring. Start with three simple steps, and in under ten minutes you get all the key NGINX graphs, more than 100 NGINX metrics, plus automated configuration file analysis and recommendations. And it’s all based on many years of first‑hand experience, coming directly from the NGINX core and support teams.
Amplify is a tool made by NGINX for NGINX users that provides near‑real‑time monitoring. It collects hundreds of metrics from NGINX or NGINX Plus, log files, and the operating system, and provides a highly customizable interface to visualize them. The metrics can be aggregated over a cluster of NGINX instances for a high‑level overview, or fine‑tuned to track the performance of individual services, APIs, or applications.
Feature‑wise, here’s what Amplify is today:
- Overview and SLA – A 30‑second checkup of NGINX health. See aggregate visualizations for key metrics such as response time, the total sum of HTTP
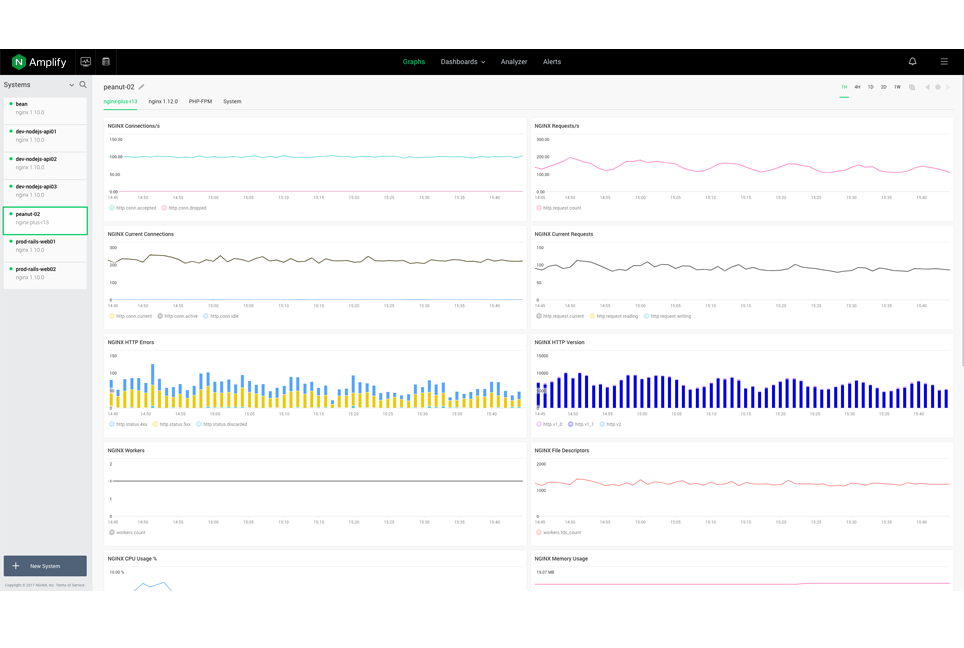
5xxerrors over the past 24 hours, and more. Compare trends by switching time periods and instantly notice trends and abnormalities. SLA measurement is based on the Application Health Score index. - Graphs – A standard set of graphs for NGINX, PHP‑FPM, and OS metrics. Graphs can be copied to user‑defined dashboards for customization.
- Analyzer – An overview of your NGINX configuration file, with alerts about common configuration problems. The static analyzer helps to improve performance, reliability, and security, based on recommendations from the NGINX team.
- Dashboards – A dashboard where you can create your own graphs. Dashboards allow you to visualize more metrics, aggregate graphs across servers, set up custom metrics based on the NGINX log variables, and more. It’s an easy‑to‑use and very flexible metric graphing instrument.
- Alerts – Notifications about abnormal NGINX behavior. When an alert is triggered, Amplify sends a notification, and then monitors the situation until it reverts back to normal.
- Inventory – The list of monitored systems. You can check hostnames, OS versions, and IP address information.
During the beta phase, we had thousands of users sign up for Amplify. We’ve been collecting close to a billion updates per day, and we’re extremely grateful to everyone who has tried it out and provided feedback. A lot of what we’ve added or changed in the past 12 months has been based on user feedback.
Here’s some of what Amplify users have said:
- A very positive experience
- Very easy to install
- Instant visibility into NGINX performance/behavior
- Outstanding NGINX monitoring capabilities, without many alternatives
- Useful, practical advice from the static analyzer – alleviates common configuration errors
- Gives insight into application quirks and errors from the NGINX vantage point
- Automated alerts are very helpful
- Nice, modern UI/UX
In the future, we’ll be adding even more to Amplify. A few ideas we’ve been working on recently include more plugins for monitoring, extensions to the static analyzer, improved alerting algorithms, availability testing, and more. If you have any ideas, feel free to share them with us!
Amplify is available for all major Linux distributions, with experimental support for other OSs. For more detailed information on supported operating systems, please refer to the Amplify documentation.
Signing up for Amplify is easy – just visit amplify.nginx.com, provide a few basic details about yourself, and hit the Create button.
For more information on Amplify, please refer to the official documentation and GitHub repo.
The post Announcing General Availability of NGINX Amplify appeared first on NGINX.