Find and Fix API Endpoint Issues with Akita’s NGINX Plus Certified Module

If you’re responsible for a production service with any number of users, you likely understand the pain of customers finding issues before you do. At Akita, we want to solve this problem – which is why we built our new NGINX Plus Certified Module.
In this blog, we’ll cover key aspects of the module, including the reason to zoom out from logs, ways to quickly find and fix issues across your system, and how the new Akita modulemakes this functionality easily available to NGINX users.
Zooming Out From Logs to API Endpoints
Today, countless developers find themselves in an unfortunate situation where their customers have effectively become their monitoring system.
It’s not that software teams aren’t logging errors. For instance, if you use NGINX as your reverse proxy, you receive all kinds of information in your NGINX logs: timestamps, request lengths and processing time, and response status code. If you have the time and patience to look for it, the information is there.
However, in systems with many different requests and responses, it’s easy to get lost in the sea of logs! Unless you’ve proactively set up dashboards or another type of tool atop the logs, you may find yourself wading through thousands – if not millions – of log lines, trying to identify potential problems and where they started. But setting up the right dashboarding and monitoring methods can take weeks, months, or even quarters. And it often needs to be updated in tandem with code.
At Akita, we believe it’s crucial to zoom out from logs to API endpoints. This enables software teams to quickly see an overview of issues and hot spots while maintaining the granularity needed to actually identify the problem. We’re solving information overload in monitoring with a fully drop-in metrics solution that automatically monitors latency metrics and errors – no code changes or building dashboards necessary. Our solution passively watches API traffic and automatically analyzes it to provide per-endpoint monitoring and alerts. Best of all: Users can get started within 15 minutes of signing up.
Introducing Akita’s NGINX Plus Certified Module
We’re excited to introduce the Akita module, now available to NGINX users. If you’re using NGINX as your web application server, reverse proxy, or API gateway, you can now send your API traffic to Akita for analysis. Sign up for a free Akita account, install the Akita module and agent, and make a small change to your NGINX configuration file.
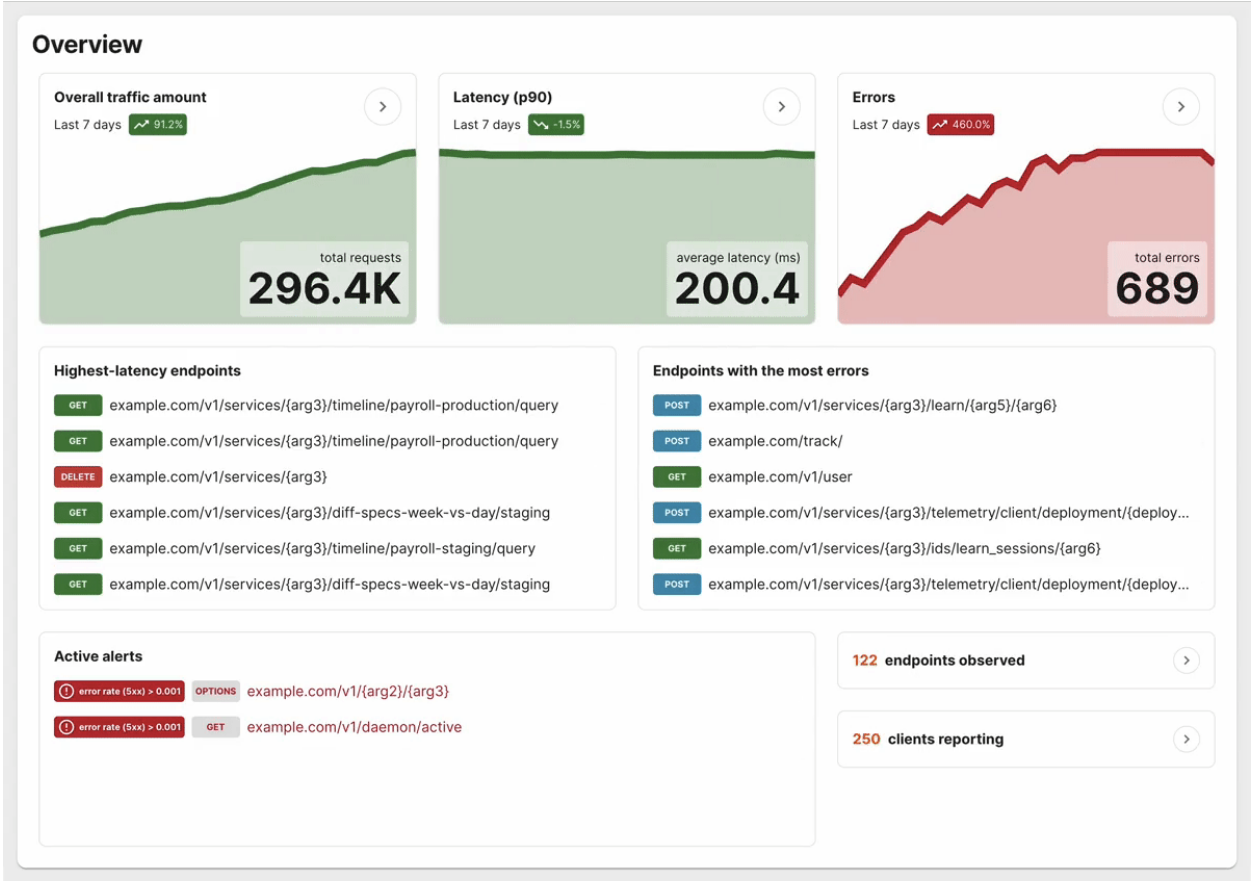
Within minutes, you’ll be able to navigate to the Akita console to see your API endpoints, what’s acting slow, and what’s throwing errors.
Akita’s NGINX Plus Certified Module gives NGINX users the many benefits of Akita as an extension of your existing NGINX setup. Akita will capture your traffic from an HTTP request and measure its latency and errors while showing you what’s going on in production with pre-built dashboards.
How Akita’s NGINX Plus Certified Module Works
Let’s dive into the module’s functionality and where it comes into play. First, requests are processed by NGINX in multiple “phases”, starting with reading the request from the network, progressing through rewrites and access control checks, and ending with generating the response and any log entries. Akita’s NGINX Plus Certified Module inserts itself late in this process (in the pre-content phase, after features like header rewriting) so it can see the request in the form most similar to what the application receives. Akita checks each incoming request to see if it’s flagged for monitoring, based on the server and location in the NGINX configuration.
Note: Just like other NGINX features and modules, you can enable Akita for just part of your web service or have it default to everything NGINX serves.
In the next phase, the module records the request body and sends it to the Akita agent as soon as the request has been fully received. This behavior is similar to the ngx_http_mirror module, as the same data goes to both the application and Akita agent in parallel.
When NGINX or an upstream server has a response ready, the Akita module records this response (up to 1MB) while it streams back to the client. The response is not delayed by this buffering, which takes place in a NGINX “content filter” that can process each chunk of the response body as it becomes available.
Once the server response time is known and the response is successful, this response is then mirrored to the Akita agent. The agent matches the request and response together, then attempts to parse the request and response body content. This data is obfuscated locally by the agent before being sent to Akita for analysis. This means Akita sees the structure of your API traffic but not the specific values being sent by or to your users.
Akita’s NGINX Plus Certified Module automatically infers your endpoints from this trace of application traffic, building a browsable, downloadable model of your API and automatically displaying latency and error information. It allows you to alert on the rate of per-endpoint errors, high latency for a specific endpoint, or even an unexpectedly high volume of calls.
For each endpoint, Akita’s NGINX Plus Certified Module enables you to see:
- The number of API calls
- HTTP response code distribution
- How long it took for your server to respond
More information about setting up Akita’s NGINX Plus Certified Module can be found here.
Get Started with Akita’s NGINX Plus Certified Module
Akita is currently in open beta. You can sign up for the beta and get results in less than 30 minutes.
The post Find and Fix API Endpoint Issues with Akita’s NGINX Plus Certified Module appeared first on NGINX.
Source: Find and Fix API Endpoint Issues with Akita’s NGINX Plus Certified Module
