Monitoring NGINX and NGINX Plus: Highlights from Our Blog

The bigger and busier your site, the more important it is to monitor it. A good monitoring solution gives you visibility into your site helping you maintain uptime, performance, and security. Monitoring is one of the most popular topics on the NGINX blog, with a completely new, NGINX‑focused monitoring tool – NGINX Amplify – added in the last year.
There are three types of monitoring solutions we’ve highlighted on the NGINX website:
- Active health checks and monitoring in NGINX Plus.
- Third party solutions from NGINX partners such as AppDynamics, Datadog, Dynatrace, and New Relic.
- NGINX Amplify, our new tool for monitoring application delivery with NGINX and NGINX Plus – introduced in 2016, and now in a very popular public beta.
Active Health Checks and Monitoring in NGINX Plus
Active health checks are one of the most useful features in NGINX Plus. A server that goes down can’t, by definition, tell you so. A server that works incorrectly (sends incorrect responses) is even harder to pinpoint. Active health checks continually test the health of your servers, enabling NGINX Plus to divert traffic away from servers that have failed or are malfunctioning.
Here are some resources to help you get the most out of active health checks and monitoring in NGINX Plus:
- A detailed description of active health checks in NGINX Plus
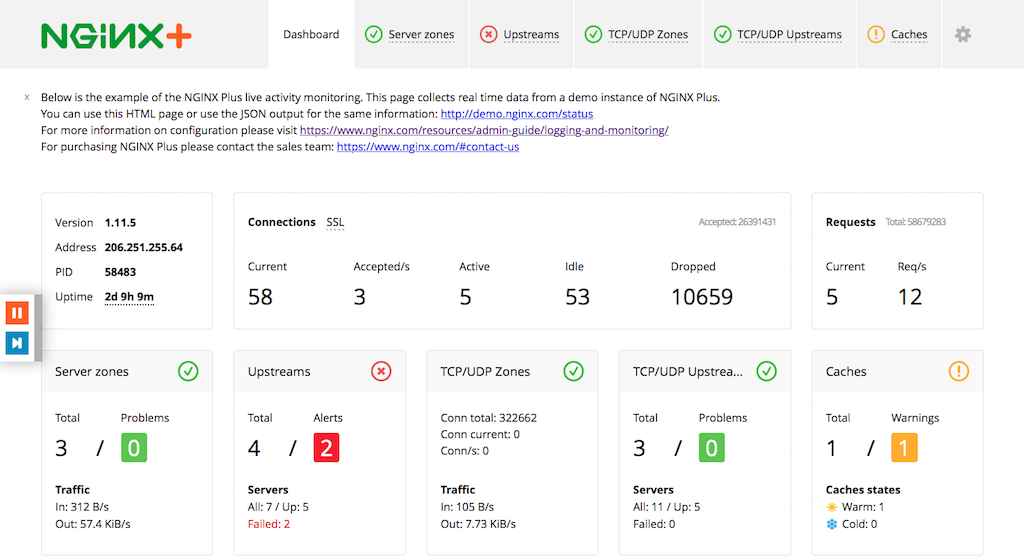
- An interactive example of the NGINX Plus live activity monitoring dashboard (and take a tour of the dashboard on our blog)
- Rick Nelson’s blog post describing how to use NGINX Plus logging for application performance management (APM)
- A blog post from our own Kevin Jones which tells you how to “roll your own” statistics collection for NGINX Plus with Go
Third‑Party Solutions from NGINX Partners
Application performance management (APM) tools help you look closely at website problems that originate in the app itself, right down to helping you identify the specific lines of code that are causing a problem.
In addition to that, the app delivery infrastructure must be properly monitored. Since NGINX runs on more than half of the world’s busiest websites, it’s no accident that leading APM software integrates with NGINX and NGINX Plus. In fact, about a quarter of NGINX partners – AppDynamics, Datadog, Dynatrace, Librato, and New Relic – are APM providers. You can display metrics collected from NGINX and NGINX Plus within your APM dashboard.
The NGINX website and YouTube channel feature many contributions on the topic of APM from NGINX and our monitoring partners:
- Our own Faisal Memon explains the value of APM and its use with NGINX
- Alexis Lê‑Quôc of Datadog and William Li of New Relic presented on monitoring at nginx.conf 2014
- Matt Williams and Carlo Cabanilla of Datadog delve into the use of APM with load balancing, scaling apps, and caching
- You can download a free plug‑in for New Relic from our website
The Launch of NGINX Amplify
NGINX Amplify is a software as a service (SaaS) solution designed specifically to monitor the open source NGINX software and NGINX Plus, with additional metrics for NGINX Plus. With NGINX Amplify you can monitor all of your NGINX servers under a single pane of glass.
Over the last year, we:
- Launched NGINX Amplify as a private beta
- Updated NGINX Amplify to support more Linux distributions, offer an easier to use interface, and analyze your NGINX or NGINX Plus configuration
- Added custom dashboards and filters
- Released NGINX Amplify as a public beta, available to everyone
NGINX Amplify has received widespread interest, and the monitoring agents have been installed on thousands of servers. It’s the subject of some of our most popular recent blog posts, including:
- Monitoring Microservices in Docker Containers with NGINX Amplify
- Setting Up NGINX Amplify in 10 Minutes
- Improving Server Configuration with NGINX Amplify Reports
- Using NGINX Amplify Custom Dashboards and Filters for Better NGINX Monitoring
The role of NGINX Amplify has also been the subject of a well‑attended webinar. NGINX Amplify has been cited in a blog post about preventing security breaches and has been implemented alongside NGINX Plus to improve application delivery at a healthcare benefits coordinator.
Conclusion
You can monitor application delivery more effectively using NGINX Plus, NGINX Amplify, and third‑party tools from our partners. Separately and – for the most power – together, these solutions make it easier to deliver your web apps with high performance, scalability, reliability, and security.
An ever‑increasing number of open source NGINX users and enterprise sites that have to scale reliably and securely are moving to NGINX Plus. To start experimenting with NGINX Plus yourself, download a free trial of NGINX Plus. To stay up to date with our new releases and more, sign up for the NGINX newsletter today.
The post Monitoring NGINX and NGINX Plus: Highlights from Our Blog appeared first on NGINX.
Source: Monitoring NGINX and NGINX Plus: Highlights from Our Blog
