Using Librato to Monitor NGINX Plus

This is a guest post by our friends at Librato, and is also posted on their blog.
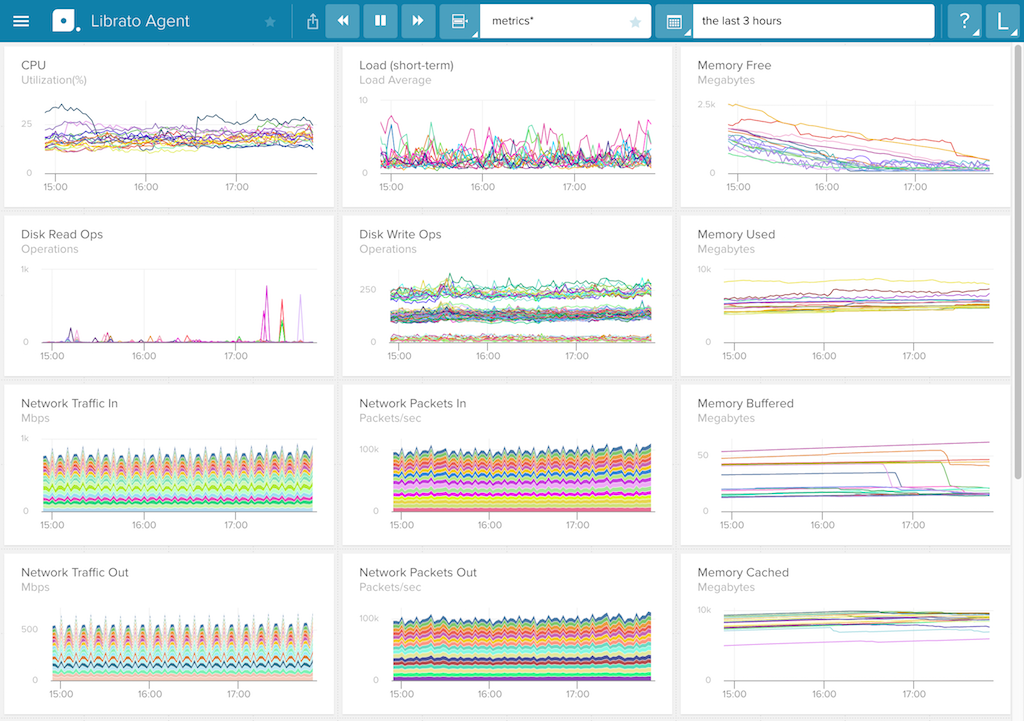
Ever struggled with setting up good monitoring for your web servers? Always wanted better graphs to understand what was really going on? Librato is a SaaS monitoring solution for collecting, analyzing, and alerting on metrics. We make it dead simple to monitor everything from your NGINX web servers all the way down to the request latency between two internal services, and much more. We’ve put a lot of work into a painless configuration process with clear, useful dashboards:
Librato has a multitude of turn‑key integrations (40+ and growing, in fact), but we are particularly proud of our NGINX Plus integration.
Librato’s NGINX Plus Integration
NGINX Plus is an enterprise‑grade edition of the popular open source NGINX web server, packed full of features. Therefore it’s critical that you be able to monitor the performance of these new capabilities, and the folks at NGINX stepped up to the plate: the Status module has been expanded to include all the metrics for the additional features. While the basic Librato NGINX integration has seven core metrics, the Librato NGINX Plus integration sports a whopping 76 metrics! That’s a whole lot of information!
Unfortunately, ten times as many metrics won’t fit on a single dashboard like the one in our open source NGINX integration. Rather than trying to cram too much information onto one massive dashboard, we’ve separated our NGINX Plus integration into five distinct dashboards, each covering a specific area of interest: an Overview dashboard, Caches, Server Zones, Streams, and Upstreams. Let’s go through them, shall we?
The Overview Dashboard
The Overview dashboard is your first stop for general health and performance of your NGINX Plus servers. You’ll find the most immediately useful metrics here, such as requests, connections, and SSL handshakes. This dashboard is quite useful for spotting potential problems and gaining a general understanding of what’s going on. We recommend keeping this dashboard handy (perhaps put it on a big screen on the wall like many of our customers do? Librato looks great spread out on a 52” monitor!)
While this dashboard is useful for a quick, at‑a‑glance overview, the rest of them dig into specific areas, useful for diagnostics and troubleshooting.
The Streams Dashboard
The Streams dashboard gives you visibility into the performance of NGINX Plus’s TCP and UDP load balancing capabilities. On this dashboard, you’ll find important graphs such as upstream health check responses, upstream response times and connections, server zone bytes received/sent, and much more.
The Server Zones Dashboard
NGINX Plus, like open source NGINX, stores configuration and state information (such as sticky sessions) in shared memory “zones”. Unlike open source NGINX, NGINX Plus provides metrics about the performance of each server zone. We’ve leveraged this new‑found capability to create a dashboard with information about every HTTP zone available, with graphs such as requests processing, bytes sent/received, and HTTP response code broken out by zone.
The Upstreams Dashboard
One of the many common use cases for NGINX Plus is as an HTTP proxy server, proxying requests to one or more backend HTTP services. Our NGINX Plus integration helps you keep an eye on these upstream services by giving you great visibility into every facet of them, from total requests across all backends to requests per specific backend, HTTP response codes per backend, and much more.
The Caches Dashboard
NGINX Plus comes with some heavy‑duty content caching capabilities, and the metrics exposed give you great insight into the performance of the caching system. Right away, you’ll see the two most important metrics for any caching system: cache hits and misses. Of course, we don’t stop there. You’ll also find graphs for the cache size, bytes written/read, and cache writes/reads.
Alerting
We all love graphs, but sometimes we need to know about problems immediately. With Librato’s robust alerting system, you can set up alerts for any NGINX Plus metric to notify you immediately when things are going wrong. Our alerting mechanisms give you fine‑grained control over thresholds, alert destinations (such as Slack, PagerDuty, email, and more), and which servers they apply to.
More Powerful Together
Of course, your NGINX Plus web servers aren’t the only thing in your infrastructure that you care about. By using Librato to monitor other components of your infrastructure, you can quickly correlate metrics and events to decrease the time it takes to investigate and resolve problems. Common scenarios such as correlating latency between your frontend servers and database servers becomes a trivial task.You can try Librato for free today: it’s as simple as signing up (no credit card required!), enabling an integration, and watching the metrics and insights flow.
And of course you’ll need NGINX Plus to try out Librato’s integration – start your free 30‑day trial today or contact us for a live demo.
The post Using Librato to Monitor NGINX Plus appeared first on NGINX.
