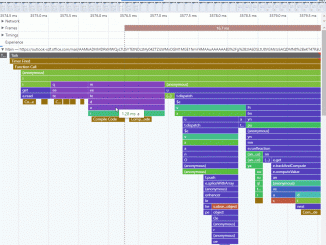
Unminifying function names in DevTools performance profiles Starting in Microsoft Edge version 99, you can use the new “Unminify profile” button in the Performance tool to download an unminified profile using your published sourcemaps. Opening this file in the Performance tool will provide you with easier-to-debug call stacks with better function names. The Performance tool in DevTools allows developers to learn more about their app’s code base by capturing events, network requests, call stacks, and more over a period of time. The recorded profiles make it possible to investigate performance issues in specific user scenarios and debug customer problems. These profiles can also be exported as JSON, making it easy to share with peers to help with investigation. Large web applications often minify their code in production to reduce the bundle size of their scripts and improve performance. This usually means [ more… ]


