Get Smart: Operational Intelligence for NGINX and NGINX Plus With Splunk Enterprise

Splunk® Enterprise is data collection and analysis software that makes it simple to act on the untapped value of the big data generated by your technology infrastructure, security systems, and business applications – giving you the insights to drive operational performance and business results.
NGINX, Inc. and Splunk have teamed up to offer the Splunk Add‑On for NGINX and NGINX Plus, which assists with indexing both NGINX log data and NGINX Plus API data, so you can glean valuable information about your NGINX or NGINX Plus deployment and the applications running within your infrastructure. This blog provides step‑by‑step instructions for downloading and configuring the Add‑On, including the following topics:
- Installing the Splunk Add‑On for NGINX and NGINX Plus
- Installing the Splunk universal forwarder
- Configuring logging for NGINX and NGINX Plus
- Enabling the Splunk Add‑On to read in data directly from the the NGINX Plus live activity monitoring API
- Using Splunk Search Processing Language to begin analyzing your data
After setting up the Splunk Add‑On for NGINX and NGINX Plus, you’ll have a wide array of valuable statistics to search and report on within your Splunk environment.
Note: Except as noted, the instructions in this blog apply to both NGINX and NGINX Plus. For brevity, we’ll refer to NGINX Plus only for the rest of the blog, except where there is a difference between the two products.
What is Splunk and How Can It Help?
Before we get started with the nitty‑gritty details of setting up the Add‑On to collect data from your NGINX Plus deployment, let’s look at Splunk’s architecture, showcasing the features that make it a powerful tool for turning your NGINX Plus logs and API data into valuable operational intelligence.
Universal Forwarder
Splunk uses an agent called the Splunk universal forwarder to listen to specific log files on a given server and forward the data to the Splunk indexer. One of the most powerful features of the Splunk universal forwarder is the ability to extract fields from the log events when the data is presented in either key‑value pairs or a structured format such as CSV or JSON. The forwarder can also make changes to the data before it is sent to the indexer, allowing you to mask sensitive information before it is sent to Splunk.
In some deployment scenarios you might not want or be able to deploy the Splunk universal forwarder on each NGINX Plus instance. In this case, you can configure NGINX Plus to transmit log data directly to the indexer by way of syslog. We’re providing instructions for both the Splunk universal forwarder and syslog log‑collection methods so that you can choose the one that works best for you. If you are having trouble deciding on the best method for your environment, see Choosing a Forwarder, or not on the Splunk blog for guidance.
<!– In general we recommend following Splunk’s best practices for logging. The sample log format in this blog and in the documentation for the Add‑On already conform to these best practices, but it is good to understand why we followed them so that any additional changes you might want to make to your log format also follow their recommended guidelines. –>
Search Processing Language
After feeding your NGINX Plus log and API data into Splunk Enterprise you can use the powerful Splunk Search Processing Language (SPL) to filter, analyze, report and graph your data in various ways, turning your data into a powerful tool for troubleshooting NGINX, root cause analysis, measuring performance, or tracking business results from your applications.
Add-Ons and Apps
Another important feature of Splunk is the ability to extend its functionality by the way of Add‑Ons and Apps. Splunk Add‑Ons allow you to import and enrich data from any source, creating a rich data set that is ready for direct analysis or use in a Splunk App. A Splunk App is a prebuilt collection of dashboards, panels, and UI elements powered by saved searches and packaged for a specific technology or use case to make Splunk immediately useful and relevant to different roles.
As mentioned before, NGINX, Inc. and Splunk have teamed up to offer the Splunk Add‑On for NGINX and NGINX Plus. You can download it directly from splunkbase, Splunk’s curated source for Splunk Apps and Add‑Ons. The Add‑On also contains the inputs and knowledge needed to automatically plug your NGINX Plus data into other popular premium Splunk Apps such as Splunk Enterprise Security, Splunk IT Service Intelligence, and the Splunk App for PCI Compliance.
Before You Get Started
The instructions in this post assume you have already installed Splunk Enterprise, have it running in your own environment, and have administrator privileges. If not, follow this tutorial on Splunk’s website to get up and running quickly. Additionally, if you are using Splunk for non‑production purposes you can request a Splunk developer license, which increases the amount of log data that you can consume daily to 10 GB rather than the 500 MB allowed by the free version.
The instructions were tested against version 6.5.1 of Splunk Enterprise, the most current version at the time of writing. We recommend that you always download the latest version.
Installing the Splunk Add‑On for NGINX and NGINX Plus
Follow these steps to install the Splunk Add‑On:
- Download the Splunk Add‑On for NGINX and NGINX Plus from splunkbase. It comes in a compressed
tarfile called splunk-add-on-for-nginx_xxx.tgz, where xxx is the Add‑On version number. - In your browser, access the hostname or IP address/port number combination for the Splunk Enterprise UI and login. The default port is 8000, but might be different in your environment. Ask your Splunk administrator for assistance if needed.
-
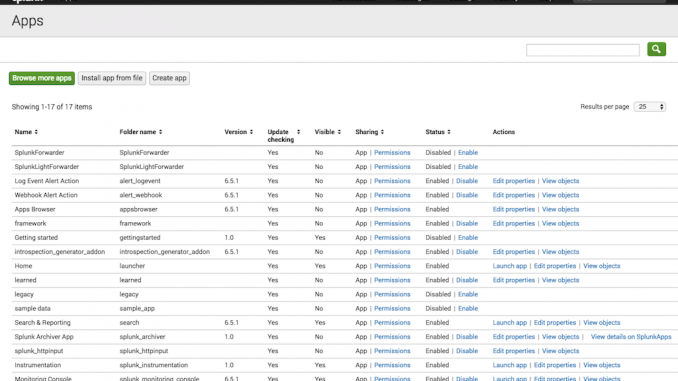
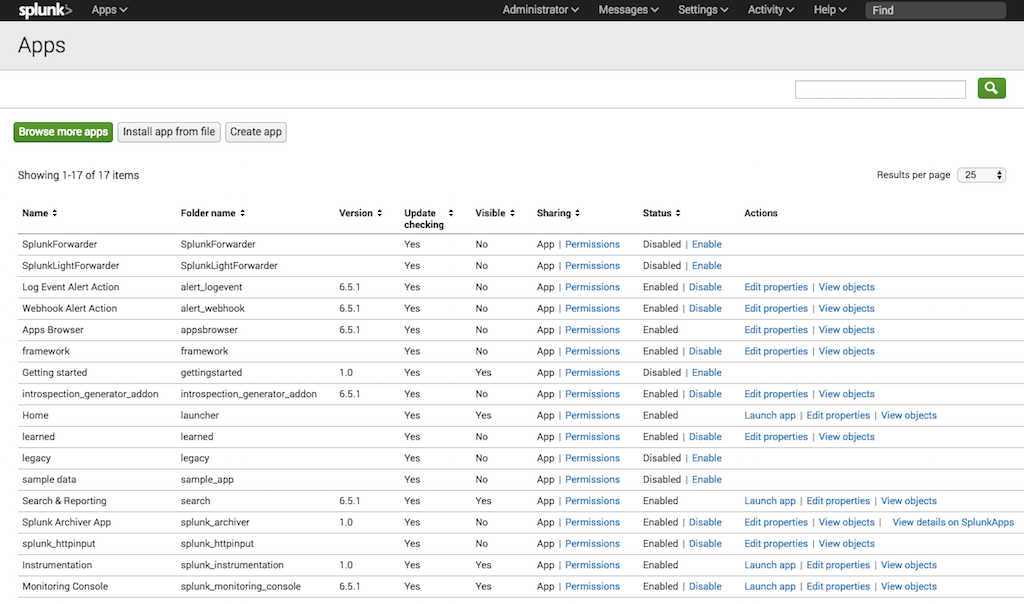
On the Apps homepage, click the gear icon to open the Apps management page, shown in the following screenshot.
-
Click the install app from file button to open the following window.
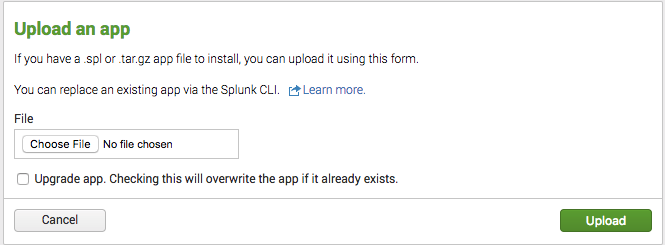
- Click Choose File, navigate to the splunk-add-on-for-nginx_xxx.tgz file you downloaded in Step 1, and click the Upload button.
- When the upload completes, a message appears indicating that Splunk needs to be restarted. Consult with your Splunk administrator to choose an appropriate time for the restart.
- After the restart is complete, navigate back to the Apps management page and verify that the Splunk Add‑On for NGINX and NGINX Plus is listed.
Installing the Splunk Universal Forwarder
As we discussed earlier, deploying the Splunk universal forwarder on the NGINX Plus host where you are logging is a powerful method for indexing logs. Follow these instructions to install and configure the universal forwarder.
-
Download the latest version of the Splunk universal forwarder for your operating system (at the time of writing, it was Splunk version 6.5.1). The sample instructions are for an Ubuntu 16.04 LTS server running NGINX Plus R11 (based on NGINX 1.11.5):
# lsb_release -a | grep Description
Description: Ubuntu 16.04.1 LTS# /usr/sbin/nginx -v
nginx version: nginx/1.11.5 (nginx-plus-r11)So for our example we download the package called splunkforwarder-6.5.1-f74036626f0c-linux-2.6-amd64.deb. For instructions for other operating systems, see the Splunk documentation.
- Copy the package to the host where the Splunk universal forwarder will run.
-
Use your operating system’s package manager to install the package.
# dpkg -i splunkforwarder-6.5.1-f74036626f0c-linux-2.6-amd64.deb

Selecting previously unselected package splunkforwarder.

(Reading database ... 57607 files and directories currently installed.)

Preparing to unpack splunkforwarder-6.5.1-f74036626f0c-linux-2.6-amd64.deb ...

Unpacking splunkforwarder (6.5.1) ...

Setting up splunkforwarder (6.5.1) ...

complete -
Start up the Splunk universal forwarder binary,
/opt/splunkforwarder/bin/splunk, with thestartoption. If this is the first time you are running the running the Splunk universal forwarder, include the‑‑accept‑licenseflag to accept the Splunk license agreement automatically.# /opt/splunkforwarder/bin/splunk start --accept-licenseThis appears to be your first time running this version of Splunk.
Splunk> All batbelt. No tights.
Checking prerequisites...
Checking mgmt port [8089]: open
Creating: /opt/splunkforwarder/var/lib/splunk
Creating: /opt/splunkforwarder/var/run/splunk
Creating: /opt/splunkforwarder/var/run/splunk/appserver/i18n
Creating: /opt/splunkforwarder/var/run/splunk/appserver/modules/static/css
Creating: /opt/splunkforwarder/var/run/splunk/upload
Creating: /opt/splunkforwarder/var/spool/splunk
Creating: /opt/splunkforwarder/var/spool/dirmoncache
Creating: /opt/splunkforwarder/var/lib/splunk/authDb
Creating: /opt/splunkforwarder/var/lib/splunk/hashDb
New certs have been generated in '/opt/splunkforwarder/etc/auth'.
Checking conf files for problems...
Done
Checking default conf files for edits...
Validating installed files against hashes from '/opt/splunkforwarder/splunkforwarder-6.5.1-f74036626f0c-linux-2.6-x86_64-manifest'
All installed files intact.
Done
All preliminary checks passed.Starting splunk server daemon (splunkd)...
Done -
Verify that the Splunk universal forwarder is running.
# ps aux | grep splunk

root     21450  0.7  4.7 183420 97924 ?  Sl   21:31   0:00 splunkd -p 8089 start

root 21451 0.0 0.6 66492 12948 ? Ss 21:31 0:00 [splunkd pid=21450] splunkd -p 8089 start [process-runner] -
Configure the Splunk universal forwarder to start automatically on reboot (Including the
enable boot‑startoption to thesplunkcommand causes aninitscript to be installed).# /opt/splunkforwarder/bin/splunk enable boot-start
Init script installed at /etc/init.d/splunk.
Init script is configured to run at boot.
Configuring Logging
Configuring logging for NGINX Plus involves a couple of steps:
- Defining the log format to use either standard key names or native JSON formatting
- Setting up the collection of NGINX Plus data via either the Splunk universal forwarder or syslog
Defining the Log Format
You can define two kinds of custom log format for NGINX Plus access logs:
- Using standard key names. This format is compatible not only with the Splunk Add‑On for NGINX and NGINX Plus, but also with other Splunk Apps such as Splunk Enterprise Security, Splunk IT Service Intelligence, and the Splunk App for PCI Compliance.
- Using JSON formatting. Splunk Enterprise can parse JSON logs, but they are not compatible with other Splunk Apps.
Defining a Log Format with Standard Key Names
We recommend that you create a custom log format for your NGINX Plus access logs that uses standard key names, to make compatible with other Splunk Apps. If you do not care about compatibility, you can modify the key names as you wish.
-
Add the following
log_formatdirective to your NGINX Plus configuration to create a new format called adv. Enclose each variable (value) in quotation marks, preceded by the indicated key name. We recommend placing the directive directly in thehttpcontext so that it is inherited by allserverblocks. The default location for thehttpcontext is the main NGINX configuration file, /etc/nginx/nginx.conf.log_format adv 'site="$server_name" server="$host” dest_port="$server_port" '
'dest_ip="$server_addr" src="$remote_addr" src_ip="$realip_remote_addr" '
'user="$remote_user" time_local="$time_local" protocol="$server_protocol" '
'status="$status" bytes_out="$bytes_sent" '
'bytes_in="$upstream_bytes_received" http_referer="$http_referer" '
'http_user_agent="$http_user_agent" nginx_version="$nginx_version" '
'http_x_forwarded_for="$http_x_forwarded_for" '
'http_x_header="$http_x_header" uri_query="$query_string" uri_path="$uri" '
'http_method="$request_method" response_time="$upstream_response_time" '
'cookie="$http_cookie" request_time="$request_time" '; -
Verify that the configuration file is syntactically correct and reload it. (If the syntax is not right, correct it before reloading.)
# /usr/sbin/nginx -t
nginx: the configuration file /etc/nginx/nginx.conf syntax is ok
nginx: configuration file /etc/nginx/nginx.conf test is successful# /usr/sbin/nginx -s reload
-
Add the following
access_logdirective to the NGINX Plus configuration, referencing the new adv log format. Again we recommend placing the directive directly in thehttpcontext (by default in the main nginx.conf file) so that it is inherited by allserverblocks.The /var/log/nginx/access.log pathname indicates the default access log file, so this directive replaces the current log format with adv. You can instead include multipleaccess_logdirectives with different pathnames and formats to create separate log files.access_log /var/log/nginx/access.log adv;
Notes:
-
The default location for the NGINX Plus error log, /var/log/nginx/error.log, is defined in the same file as the default access log. We aren’t changing that location, but take note of it because we’ll use it later in Collecting Log Data via the Splunk Universal Forwarder.
error_log /var/log/nginx/error.log notice; -
As of the time of writing, the custom log format used for the Splunk Add‑On is only compatible with logs coming from the
httpmodule. If you are using thestreammodule, you still can create a custom log format that is forwarded to Splunk Enterprise, but the data structure is not compatible with other Splunk Apps.
Defining a Log Format with JSON Formatting
In NGINX 1.11.8 and later, you can use the escape parameter to the log_format directive to automatically escape JSON characters that are contained in NGINX variables (for NGINX Plus customers, this feature will become available in Release 12).
Follow the instructions in Defining a Log Format with Standard Key Names, making the following substitutions:
-
In Step 1, add the following
log_formatdirective to your NGINX Plus configuration to create a new format called json. Include theescape=jsonparameter.
log_format json escape=json '{'

                              '"time_local": "$time_local",'

                              '"core": {'

                                '"body_bytes_sent": "$body_bytes_sent",'

                                '"remote_addr": "$remote_addr",'

                                '"remote_user": "$remote_user",'

                                '"request": "$request",'

                                '"http": {'

                                  '"http_referer": "$http_referer",'

                                  '"http_user_agent": "$http_user_agent",'

                                  '"http_x_forwarded_for": "$http_x_forwarded_for"'

                                '}'

                              '}'

'}'; -
In Step 3, add the following
access_logdirective to the NGINX Plus configuration, referencing the json log format instead of adv.access_log /var/log/nginx/access.log json;
The resulting entries in the NGINX Plus access log look like this:
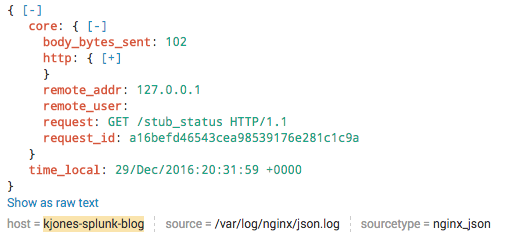
{"time_local": "29/Dec/2016:20:31:59 +0000","core": {"body_bytes_sent": "102","remote_addr": "127.0.0.1","remote_user": "","request": "GET /stub_status HTTP/1.1","http": {"http_referer": "","http_user_agent": "nginx-amplify-agent/0.40-2","http_x_forwarded_for": ""}}}Splunk Enterprise automatically parses JSON‑structured logs and displays each log entry (event) in an easy‑to‑navigate structure, as shown in the following screenshot. You can expand and contract the JSON structure by clicking the plus and minus characters just to the right of the curly braces. You can also view the plain text version of the log by clicking Show as raw text.
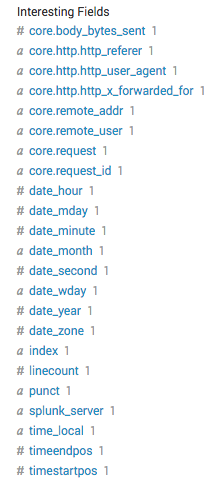
Splunk Enterprise also creates an entry in the Interesting Fields list for each statistic, which you can then search on. As shown in the following screenshot, the name of the entry indicates its place in the JSON structure, with the levels separated by a period.
Note that when you use the JSON log format, the data structure is not compatible with other Splunk Apps.
Collecting Log Data
You can collect log data in Splunk Enterprise through two tools. We provide instructions for both:
Collecting Log Data with the Splunk Universal Forwarder
At this point the Splunk universal forwarder is installed and NGINX Plus is using the custom adv log format for the access log. If you have an existing Splunk Enterprise server, you have probably set it up to receive data over TCP on a certain port, as configured in the Forwarding and receiving section of the Settings tab in the Splunk Enterprise UI (you can also use the Splunk CLI on a Splunk server to set the port). The following instructions assume that you have configured Splunk to receive data on the default port, 9997. For instructions, see the Splunk documentation.
-
Configure the Splunk universal forwarder to forward its logs over TCP to the Splunk indexer, by editing the outputs.conf file (located by default in $SPLUNK_HOME/etc/system/local/).
Create or modify the following stanzas and attribute‑value pairs. Set the
defaultGroupattribute to the valuenginxso that the Splunk universal forwarder notifies Splunk where the data is coming from. Set theserverattribute at the bottom of the file to the hostname and port to which the Splunk universal forwarder. In the example, the hostname is splunk.example.com and the port 9997; adjust these values for your deployment.[tcpout]
defaultGroup = nginx[tcpout:nginx]
server = splunk.example.com:9997[tcpout-server://splunk.example.com:9997]
-
Tell the Splunk universal forwarder where to look for NGINX Plus logs, plus the “sourcetype” of the data, by editing the inputs.conf file (by default located in the same directory as the outputs.conf file, $SPLUNK_HOME/etc/system/local/).
Set the indicated attribute‑value pairs in the
monitorstanzas to identify the access and error logs. If you plan to use this data with the Splunk Add‑On for NGINX and NGINX Plus, thesourcetypevalues shown are mandatory. You can, however, change the path to one or both files (access log and error log) as appropriate. The pathname can contain certain regular expression characters if you want to consolidate your configurations. For more information, see the Splunk documentation.# Monitor NGINX Logs[monitor:///var/log/nginx/access.log]
disabled = false
sourcetype = nginx:plus:kv[monitor:///var/log/nginx/error.log]
disabled = false
sourcetype = nginx:plus:errorNote: There are system‑wide default configuration files that override the local configurations (they’re located in $SPLUNK_HOME/etc/apps/SplunkUniversalForwarder/default/). Splunk recommends not making changes to the default configuration, but you might need to reference the default files in case you have issues setting up the forwarder.
-
Restart the Splunk universal forwarder to have it start start sending data to the Splunk instance. This could take a minute so be patient.
# /opt/splunkforwarder/bin/splunk restart
Stopping splunkd...
Shutting down. Please wait, as this may take a few minutes.
.
Stopping splunk helpers...Done.
Splunk> Australian for grep.
Checking prerequisites...
Checking mgmt port [8089]: open
Checking conf files for problems...
Done
Checking default conf files for edits...
Validating installed files against hashes from '/opt/splunkforwarder/splunkforwarder-6.5.1-f74036626f0c-linux-2.6-x86_64-manifest'
File '/opt/splunkforwarder/etc/apps/SplunkUniversalForwarder/default/inputs.conf' changed.
File '/opt/splunkforwarder/etc/apps/SplunkUniversalForwarder/default/outputs.conf' changed.
All preliminary checks passed.Starting splunk server daemon (splunkd)...
Done -
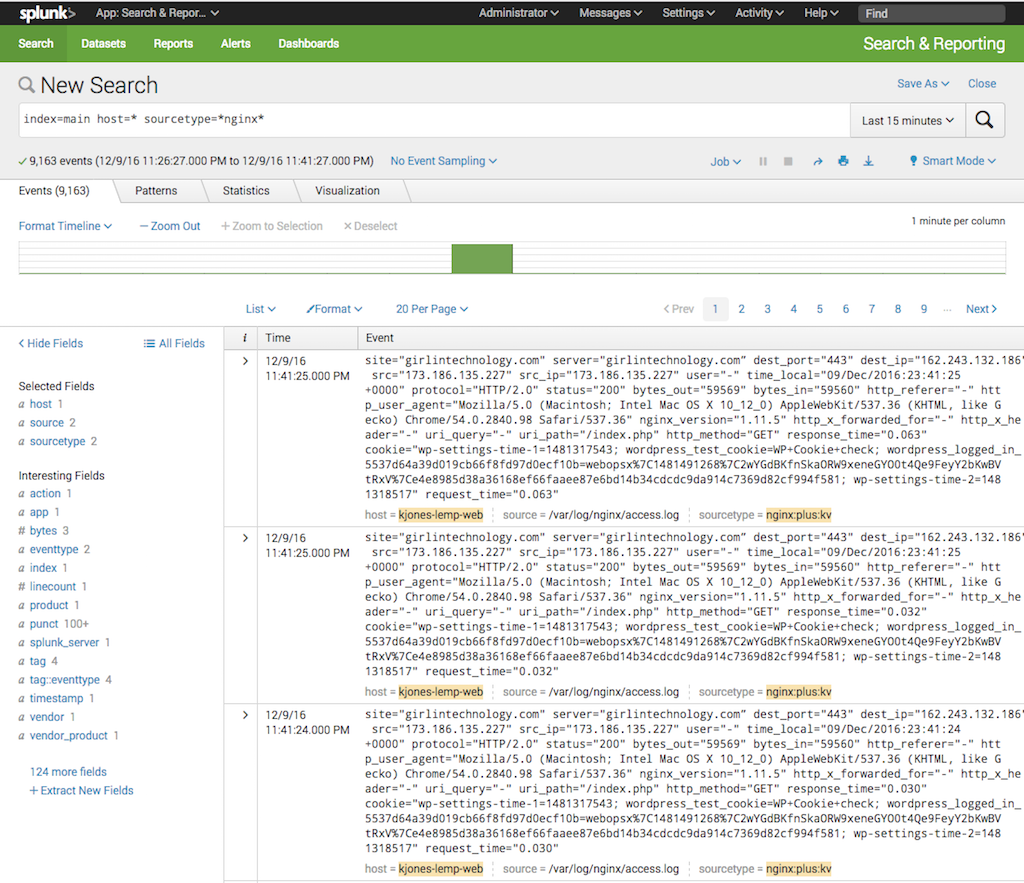
To verify that log data is being indexed properly, log in to your Splunk Enterprise UI and open the Search & Reporting App. A search for:
index=main host=* sourcetype=*nginx*returns all of your NGINX access and error logs as shown in the following screenshot.
Using Splunk SPL you can narrow down your search. Here is a quick overview of the fields that SPL reports by default. For more about SPL, see Using Splunk Search Processing Language below.
- index – The index where the data was stored on Splunk Enterprise.
- host – The actual hostname of the server that is forwarding logs to Splunk Enterprise. This is typically the FQDN.
- source – The path to the actual log file from the host.
- sourcetype – The
sourcetypespecified in inputs.conf on the host.
Splunk Enterprise also creates even more Interesting Fields from the key‑value data in the log files. You can use these fields to narrow down your search even further.
Collecting Log Data via syslog
Optionally, you can configure Splunk to collect data over network input (via syslog). In certain scenarios this might be the prefered method for collecting log data.
-
Configure Splunk to receive log data via syslog on a UDP port. In our example, we have chosen UDP port 514; for complete instructions on setting the port number, see the Splunk documentation.
-
Edit the main configuration file (nginx.conf) to have NGINX Plus send both access log and error log data directly to the Splunk Enterprise server.
# send log data directly to syslog

error_log syslog:server=splunk.example.com debug;

access_log syslog:server=splunk.example.com,severity=info main;
We are not specifying a port number, so the default port of 514 is used. If your Splunk Enterprise server is listening on a different port, add it after the server name, separated by a colon (in the example, the server name is
splunk.example.com). -
Verify that the configuration file is syntactically correct and reload it. (If the syntax is not right, correct it before reloading.)
# /usr/sbin/nginx -t
nginx: the configuration file /etc/nginx/nginx.conf syntax is ok
nginx: configuration file /etc/nginx/nginx.conf test is successful# /usr/sbin/nginx -s reload
-
You can verify that log data is being indexed properly by searching for the following string in the Search & Reporting App:
index=* sourcetype=syslog
You can get more information on configuring NGINX and NGINX Plus to send logs to syslog in Logging to syslog at nginx.org. Note that – as with the JSON log format – the data structure resulting from the syslog method is not compatible with other Splunk Apps such as Splunk Enterprise Security, Splunk IT Service Intelligence, and the Splunk App for PCI Compliance.
Using the NGINX Splunk Add‑On to Read In NGINX Plus API Data
Follow these steps to set up the Splunk Add-On for NGINX and NGINX Plus to collect data from the NGINX Plus live activity monitoring API:
- Configure the live activity monitoring API. The Live Activity Monitoring of NGINX Plus in 3 Simple Steps blog post by Nick Shadrin gives quick and easy instructions. See the NGINX Plus Admin Guide for additional information.
- Log into the Splunk Enterprise UI, click Settings in the top navigation bar, and select Data Inputs in the DATA category. The Splunk Add-On for NGINX and NGINX Plus is listed under Local Inputs.
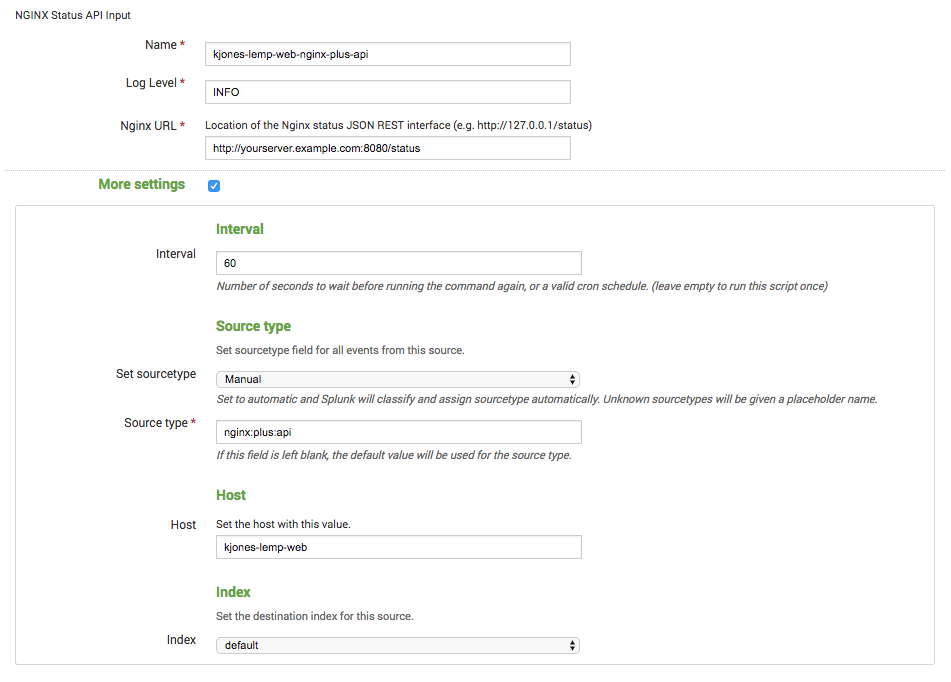
- Click Add new in the Actions column to add the API endpoint to Splunk Enterprise. The NGINX Status API Input window opens.
-
Click More settings to open the full set of fields, as shown in the screenshot below. Then fill in the following fields:
- Name – An identifying name of your choice for the API endpoint.
- Nginx URL – The URL for the live activity monitoring API, ending in /status.
- Interval – The frequency at which Splunk Enterprise collects another set of statistics, in seconds. Here we’ve specified 60 seconds.
- Host – The hostname of the NGINX Plus server from which statistics are collected.
- Click the Next > button at the top of the window to save your configuration.
-
You can verify that the Add-On is collecting API data by searching for the following string in the Search & Reporting App:
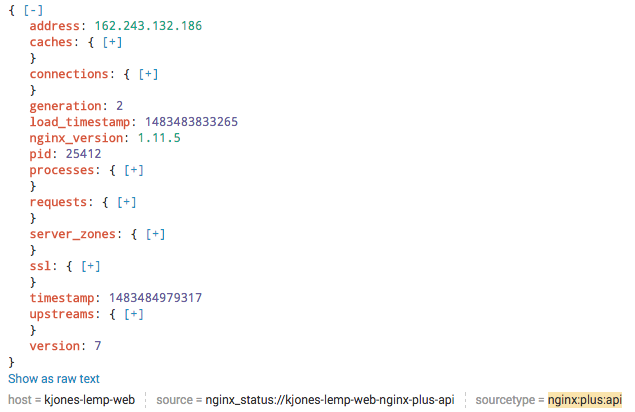
index=* sourcetype="nginx:plus:api"It can take a minute for results like the following to appear (here, the results are indexed JSON data). For each event, you can expand and contract the nested values by clicking the plus and minus signs, and the Interesting Fields list is automatically populated and searchable.
Using Splunk Search Processing Language
Data in Splunk consists of a collection of events. An event is a set of values associated with a timestamp, which is typically extracted from the log file or manually added by Splunk at the time it takes in the data. With Splunk’s powerful Search Processing Language (SPL), you can quickly search through and filter your data.
With SPL, you can search for key-value pairs using a series of commands separated with the pipe ( | ) character. Search requests can include keywords, quoted phrases, Boolean expressions, wildcards, field name-value pairs, and comparison expressions.
SPL is an extremely powerful tool, but its syntax can be complicated. Fortunately, Splunk provides thorough documentation, including a Quick Reference Guide that’s a good place to start understanding the core search components, and the Search Reference page.
For examples of how to use Splunk SPL to monitor application performance, check out Using NGINX Logging for Application Performance Monitoring on our blog.
Conclusion
Splunk Enterprise can consume both logs (from NGINX and NGINX Plus) and data from the NGINX Plus live activity monitoring API. We’ve discussed the various methods for feeding the data into Splunk Enterprise, including the Splunk universal forwarder and network input via syslog. Now you’re ready to index your data into Splunk Enterprise and start searching and reporting on your data. Get started today with a free 30‑day trial of NGINX Plus, or contact us for a demo.
The post Get Smart: Operational Intelligence for NGINX and NGINX Plus With Splunk Enterprise appeared first on NGINX.
Source: Get Smart: Operational Intelligence for NGINX and NGINX Plus With Splunk Enterprise



Leave a Reply