Introducing the NGINX Controller Data Forwarder with Splunk Integration

p.search {
text-indent: 20px;
color:#666666;
font-weight:bolder;
white-space: nowrap;
}
At NGINX, we know you invest in many tools (and business workflows around those tools) to create, deliver, and manage modern apps. Visibility and analytics tools are no exception. At last month’s Controller and Coffee webinar on how to Optimize Performance with Application‑Centric Analytics, over half of attendees told us they’re using from three to five different tools to monitor and troubleshoot application performance. That’s why we’re investing in several capabilities around integrating NGINX Controller with analytics tools in your corporate ecosystem. To that end, we’re introducing a new NGINX Controller capability we call the Data Forwarder (“Forwarder” for short).
Introducing the NGINX Controller Data Forwarder
NGINX Controller is our cloud‑agnostic control plane solution for managing your NGINX Plus instances across multiple locations and environments. One key benefit of Controller is the critical insight it provides into app performance and error states, and it’s important that such powerful analytics not be trapped in a data silo or island in your environment. We recognize that your existing investment in tools and the business processes built around them spans many functions – including operational awareness, problem alerting, auditing, and long‑term performance analysis – and we want to help you maximize your ROI.
With the release of NGINX Controller 3.6, the Data Forwarder is introduced as a beta feature with compatibility for Splunk. With the Data Forwarder, you create a single configuration to capture enhanced data from all of your NGINX Plus instances without the overhead of managing agents on each instance.
To get started forwarding events from NGINX Controller to Splunk, follow the easy steps in Setting Up the Data Forwarder for Splunk. The Forwarder immediately begins forwarding data to the Splunk HTTP Event Collector and you can quickly realize the value of metrics collected (and logically labeled) by NGINX Controller and displayed in Splunk.
Setting Up the Data Forwarder for Splunk
Enabling the NGINX Controller Data Forwarder is simple and straightforward – in fact it’s just three steps that take less than five minutes. Here’s a video showing how to enable the Data Forwarder for Splunk, followed by a written summary with screenshots.
Step 1: Enabling the HTTP Event Collector in Splunk (0:35)
In the video, we create an HTTP Event Collector in Splunk Enterprise, but you can adapt the instructions for your Splunk version. For version‑specific details, see the Splunk documentation.
- In the Splunk Enterprise GUI, click Settings in the title bar and then Data inputs in the DATA section of the pop‑up menu.
- In the Data inputs window that opens, click the + Add new button at the right end of the HTTP Event Collector row in the Local inputs table.
-
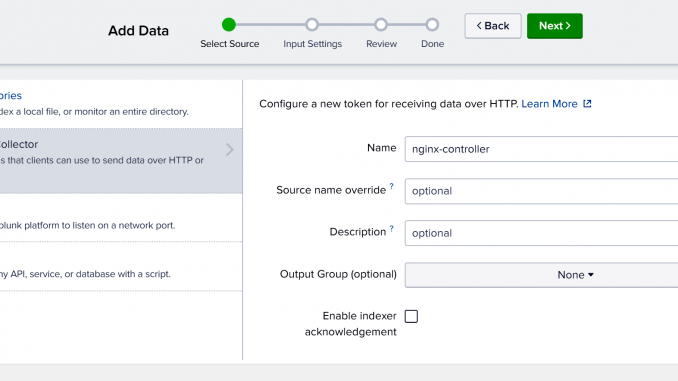
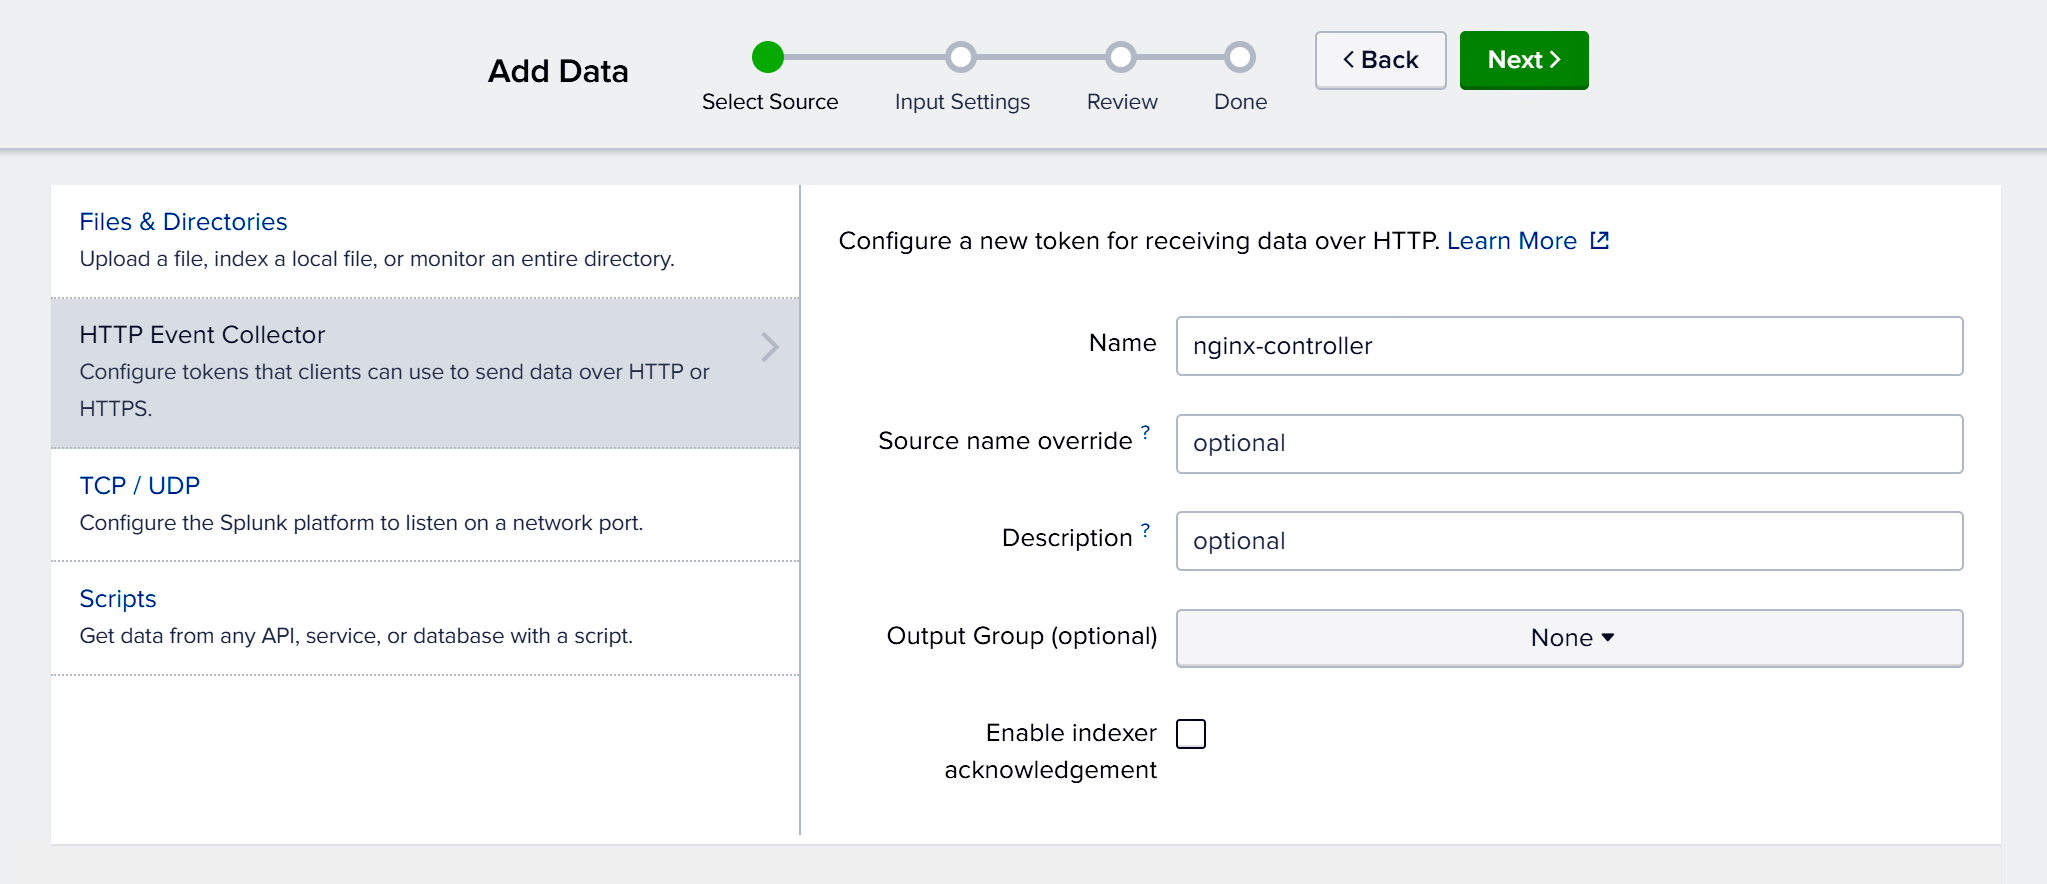
In the Select Source window, type the collector name in the Name field (in the video it is nginx-controller). Click the Next> button.
- In the Select Allowed Indexes section of the Input Settings window, click add all and then the Review> button.
- In the Review window, click the Submit> button.
-
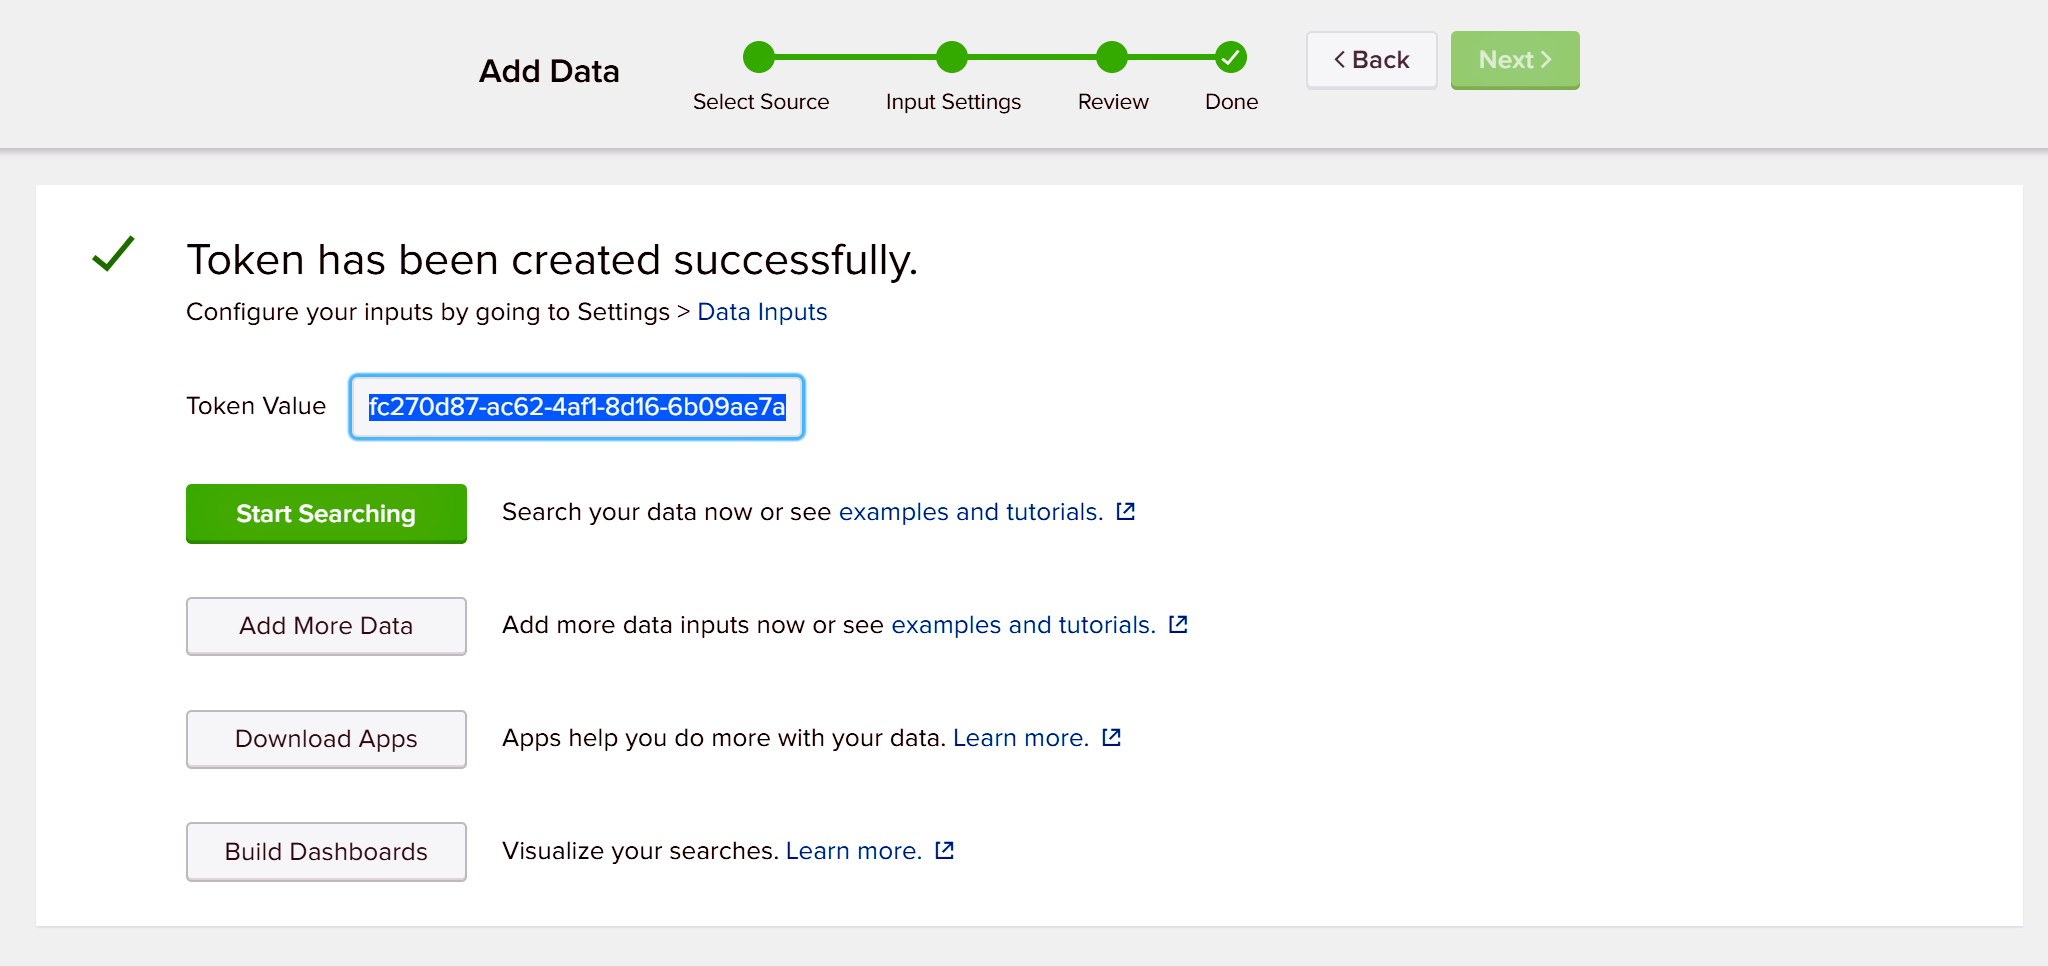
In the Done window, copy the value in the Token Value field to the paste buffer (and for safety also make a note of it). You’ll use it in Substep 3 of Step 2: Creating an Integration in NGINX Controller.
Step 2: Creating an Integration in NGINX Controller (1:00)
- In the Controller GUI, click the menu icon in the upper left corner and then Platform in the navigation column that opens.
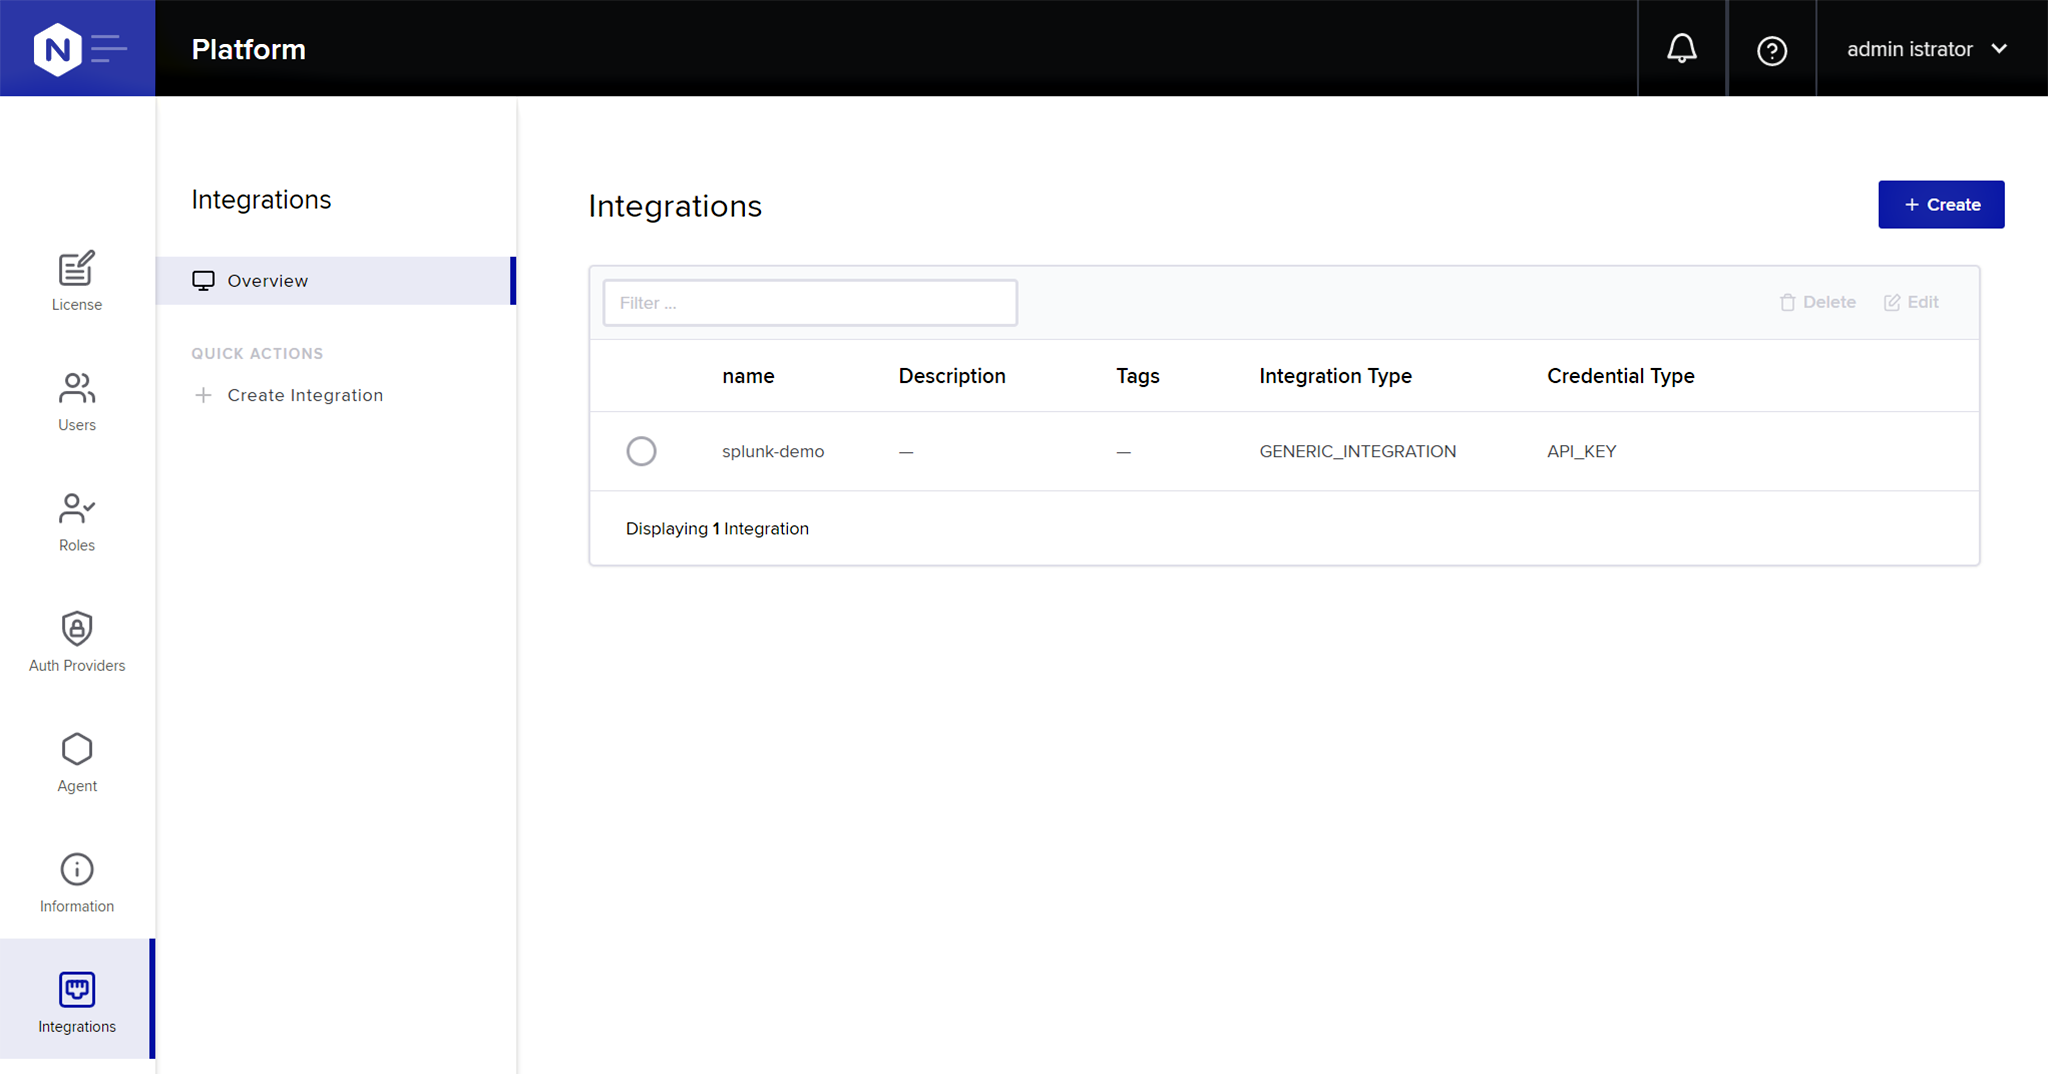
- In the Platform window that opens, click Integrations in the left navigation column. Click the Create Integration button.
-
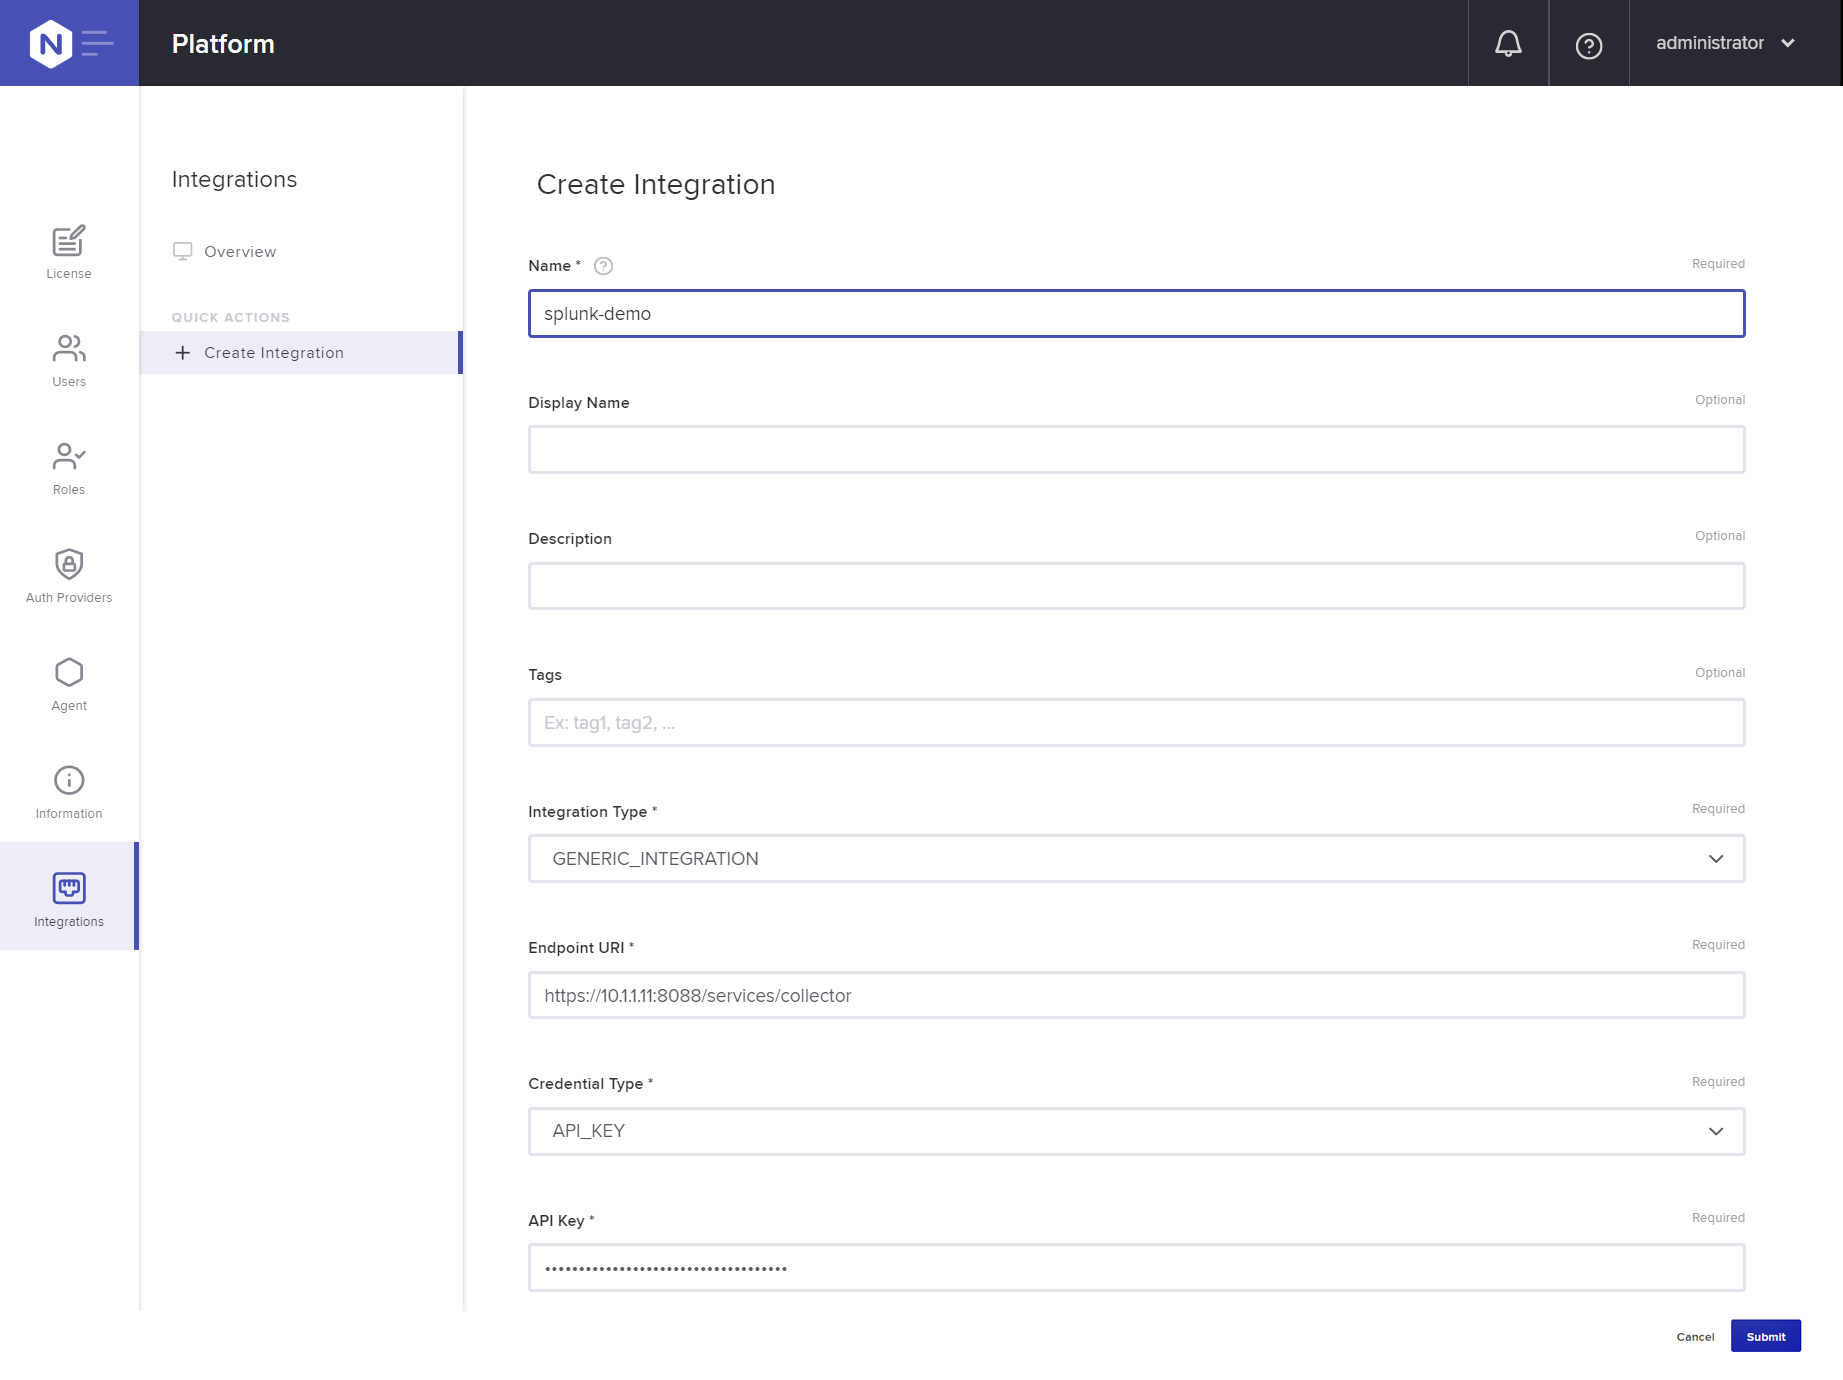
In the Create Integration window, type or select values in the following fields:
- Name – splunk-demo
- Integration Type – GENERIC_INTEGRATION
- Endpoint URI – The FQDN of the Splunk HTTP Event Collector endpoint; in the video we select the default, https://Splunk_IP_address:8088/services/collector
- Credential Type – API_KEY
- API Key – The token value from Substep 6 of Step 1: Enabling the HTTP Event Collector in Splunk.
-
Click the Submit button. The new integration appears in the summary table.
Step 3: Configuring the Data Forwarder with the NGINX Controller API (1:57)
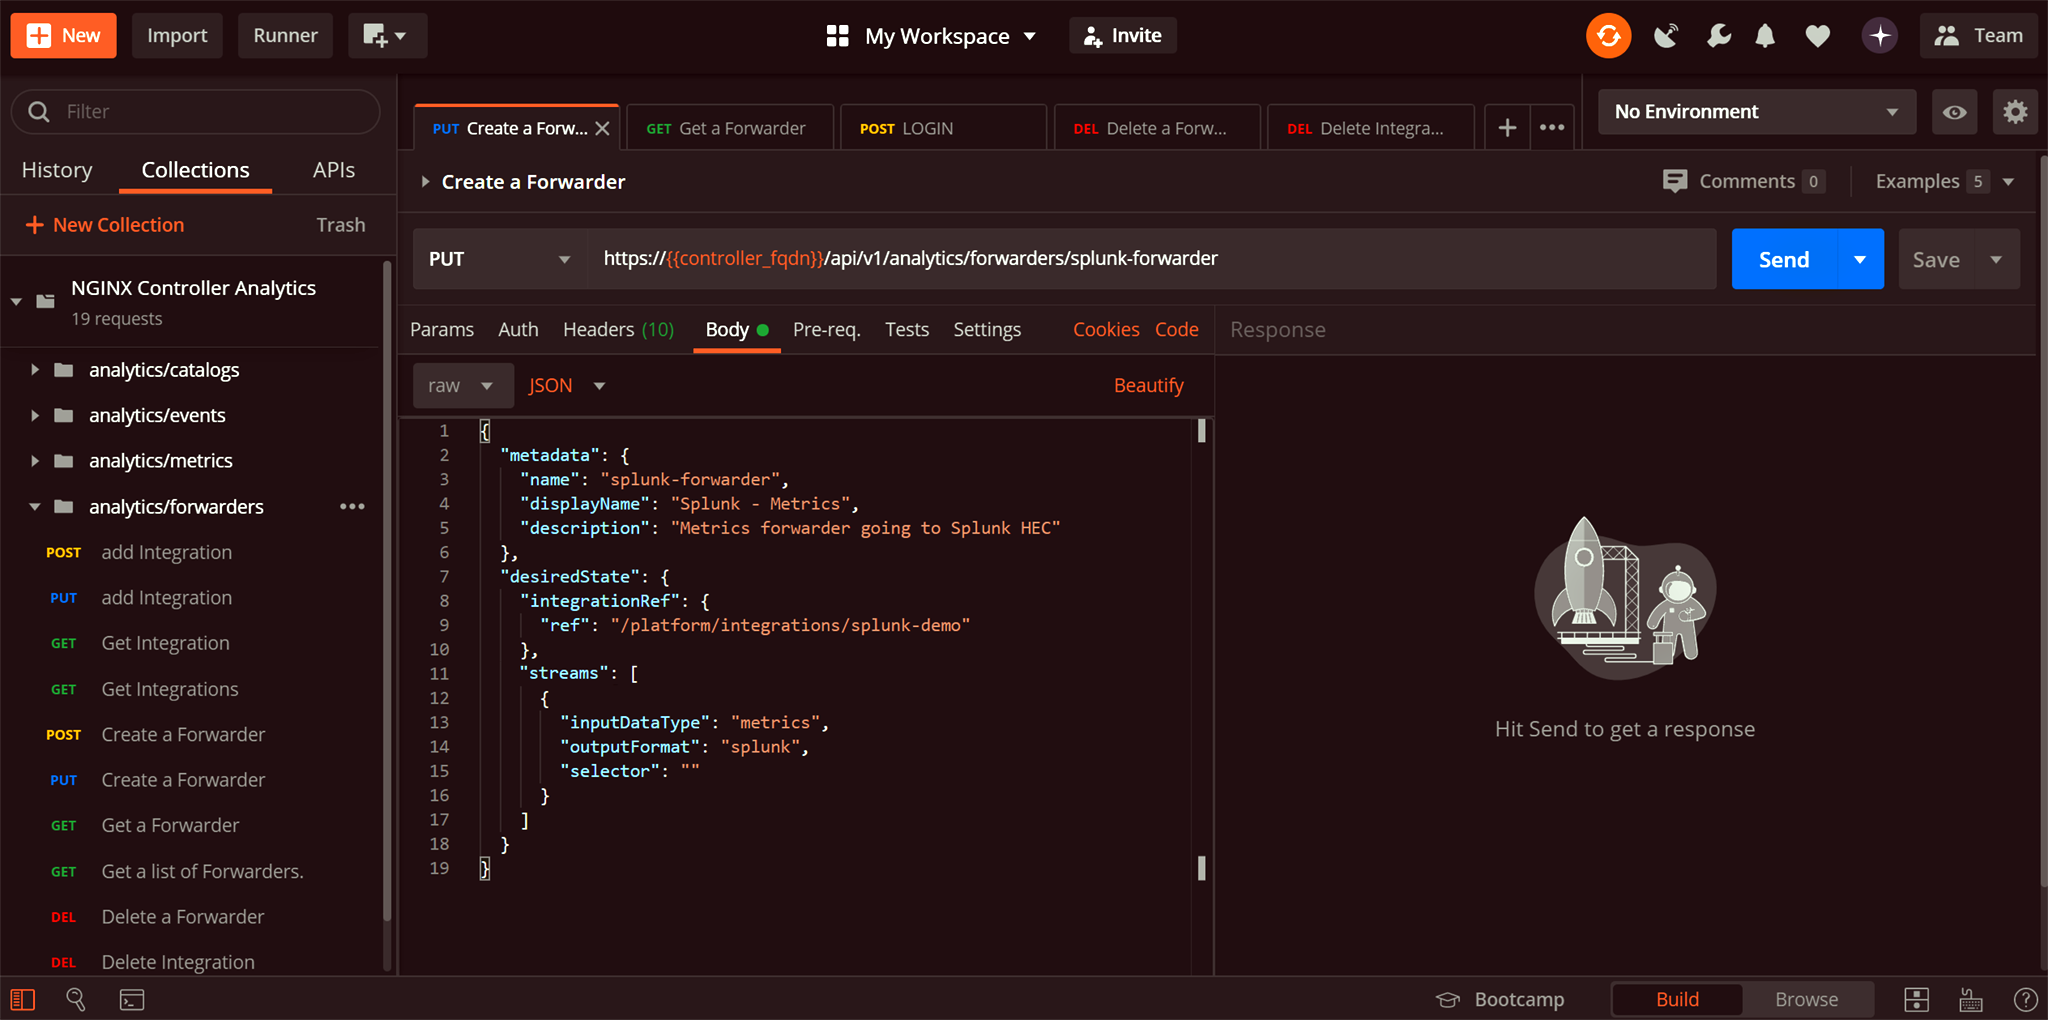
At the time this blog was published, the Data Forwarder for Splunk was a beta NGINX Controller feature, and so accessible only through the Controller API. In the video we use Postman to submit the appropriate JSON payload, but you can use the tool of your choice.
-
Authenticate with the Controller API by submitting the following JSON payload at the login endpoint, https://Controller_FQDN/api/v1/platform/login:
{ "credentials": { "type": "BASIC", "username": "email_address", "password": "password" } } - Capture the ephemeral session token for use in the next step.
-
Using Postman, use the
PUTorPOSTmethod to submit this JSON payload to the Controller API.Note how the
integrationReffield refers to the splunk-demo integration we defined in Substep 3 of Step 2: Creating an Integration in NGINX Controller. In the video we describe the purpose of other fields as well.{ "metadata": { "name": "splunk-forwarder", "displayName": "Splunk - Metrics", "description": "Metrics forwarder going to Splunk HTTP Event Collector" }, "desiredState": { "integrationRef": { "ref": "/platform/integrations/splunk-demo" }, "streams": [ { "inputDataType": "metrics", "outputFormat": "splunk_hec", "selector": "" } ] } }
Displaying Controller Metrics in Splunk (2:55)
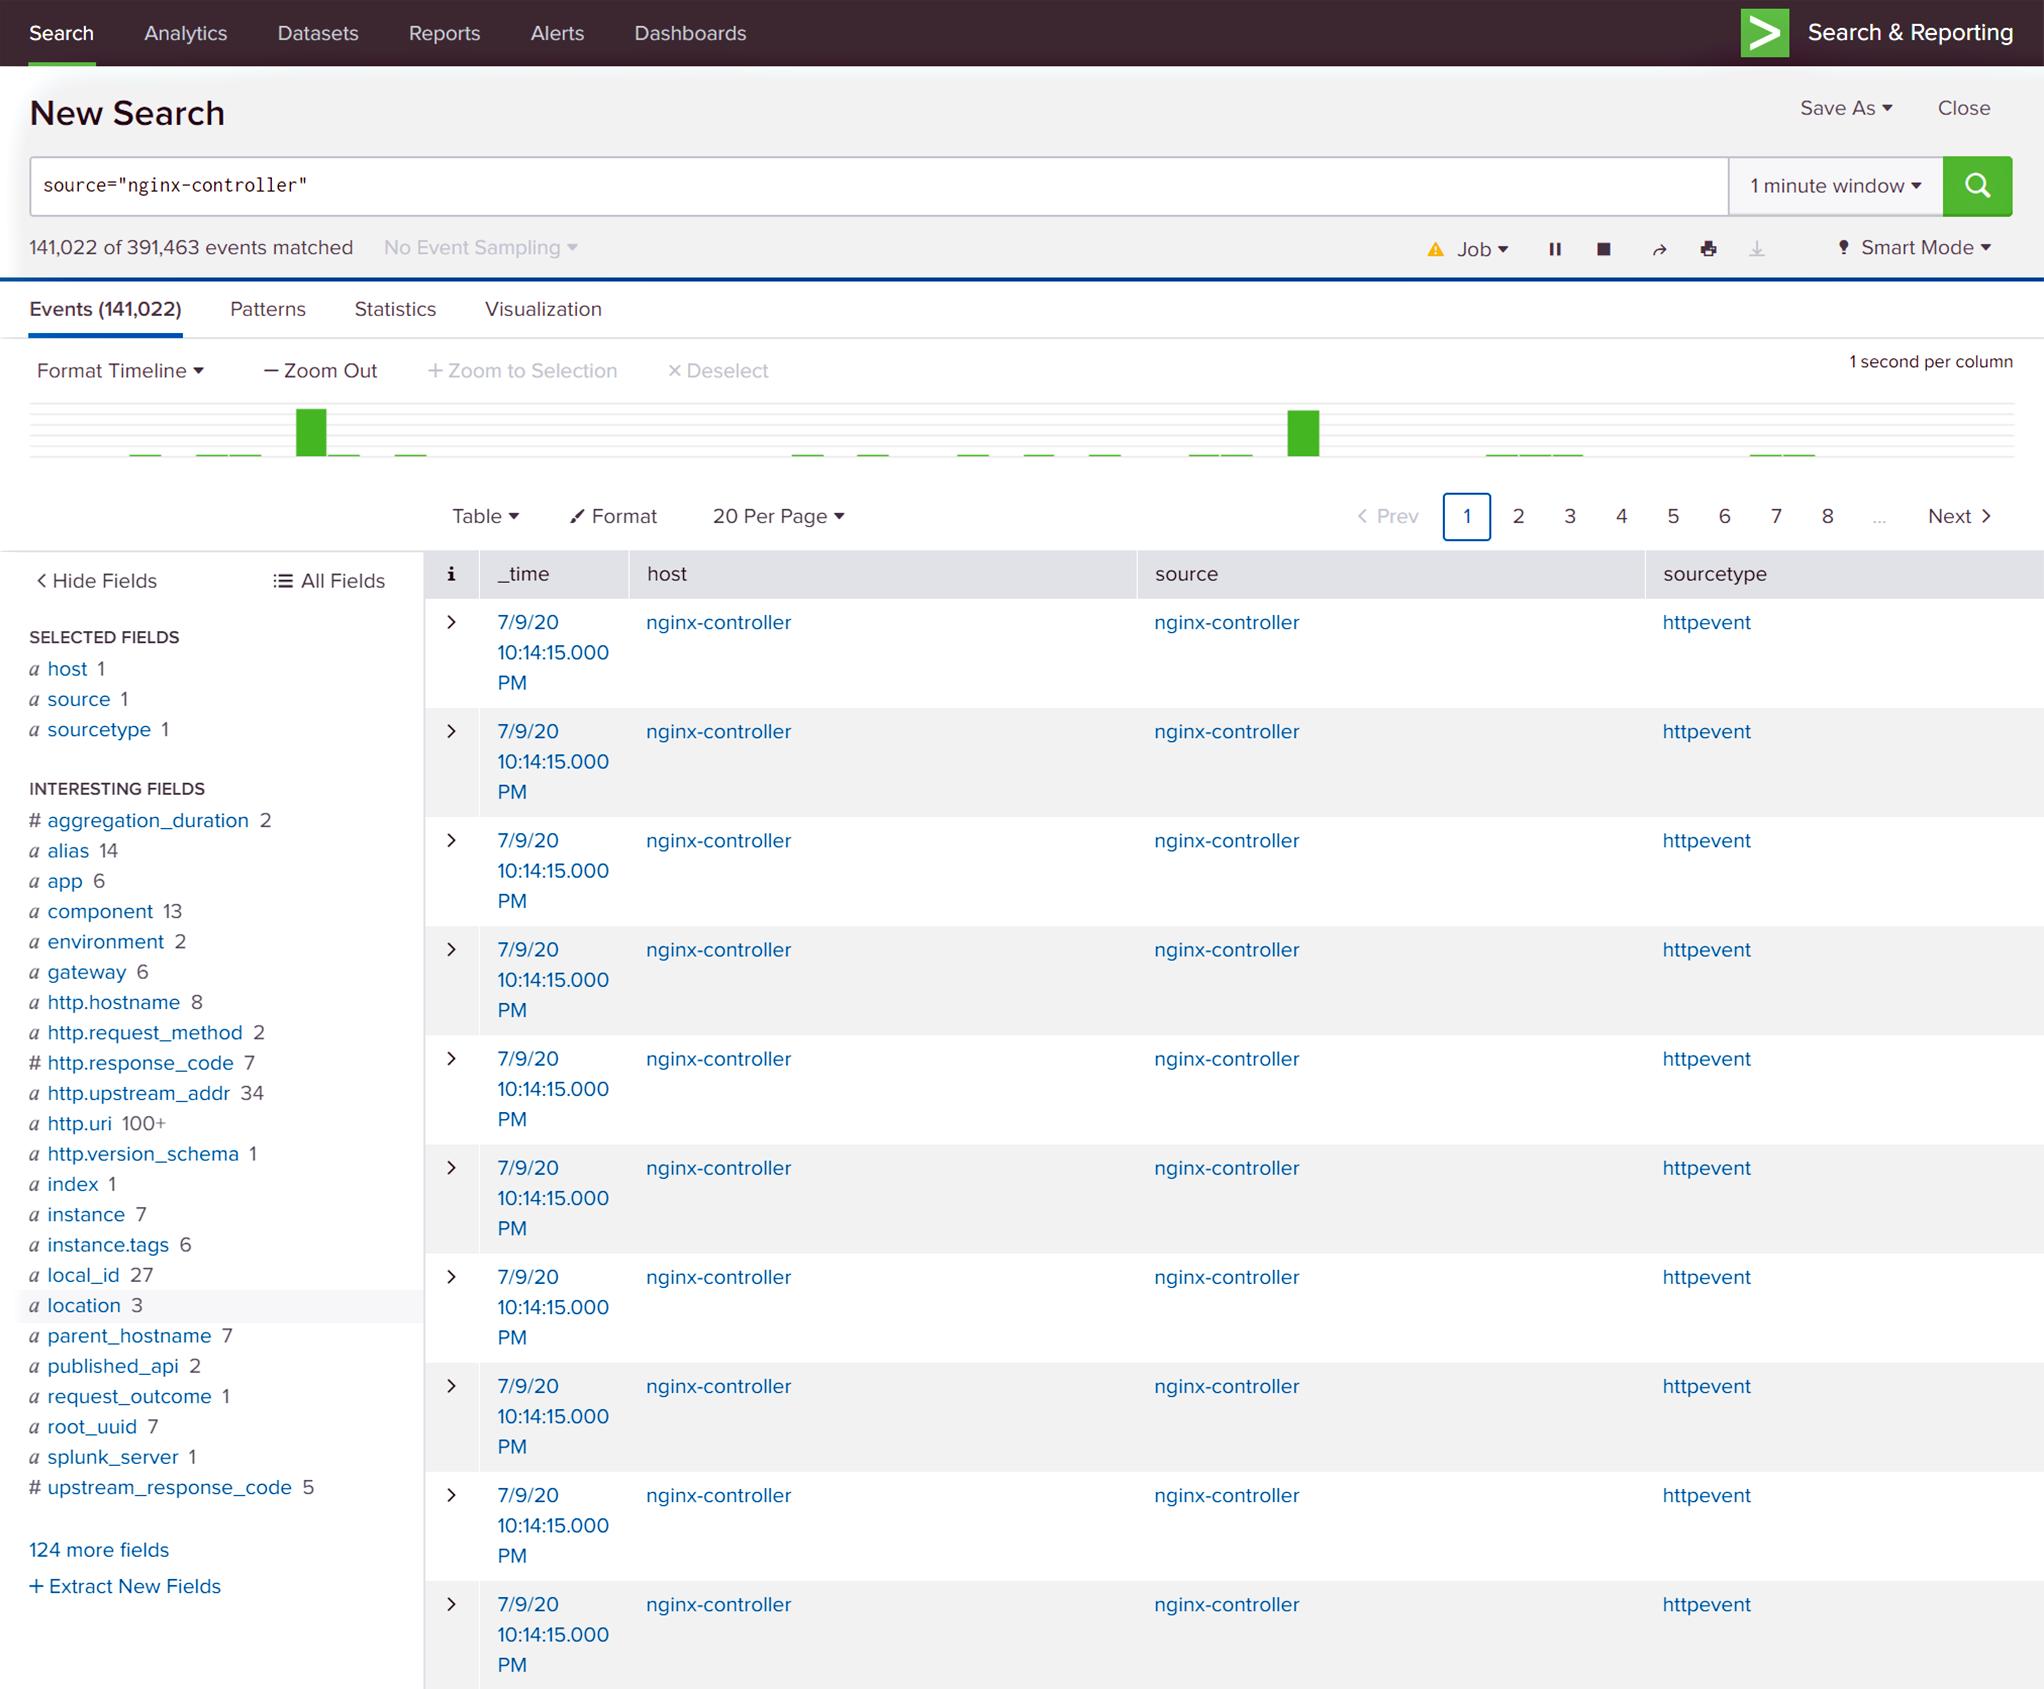
Return to Splunk to see the integration in action! If you already have traffic flowing through the NGINX Plus instances being managed by NGINX Controller, you’ll see messages begin to show up in Splunk within a minute.
Tip: Enable smart mode so that Splunk can automatically pick up on “interesting” fields, such as http.hostname, http.request_method, etc. In the video, we walk through several of them.
- In the Splunk Enterprise GUI, open the left navigation column and click Search & Reporting .
-
In the search bar on the Search window, type:
source=”nginx-controller”
Now you’re all set to begin adding the NGINX Controller data to your existing Splunk dashboards or begin building new dashboards.
Optimizing the Data Feed
We don’t go into them in the video, but there are a number of ways to optimize the data that the Forwarder sends to Splunk.
Creating a Splunk Metrics Index
By default, Splunk applies its Events index to the search results. Because the Forwarder sends metrics to Splunk, you can make Splunk data processing far more efficient by adding a Metrics index to the set of HTTP Event Collector indexes. You can dedicate the index to NGINX Controller metrics if you like. For instructions, see the Splunk documentation.
Then in the search bar on the Splunk Search window, type the following, where metrics‑index is the name of the index you created:
search-term | msearch index=”metrics-index” | sort –_time
For more information, see the built‑in NGINX Controller documentation: https://NGINX_Controller_instance/docs/analytics/forwarders/splunk-integration/
Filtering the Data Before Forwarding to Splunk
You might be wondering what data is available from NGINX Controller. It can actually tell you what data is available, as well as describe it. To retrieve the entire catalog of metrics and the associated dimensions, send a GET request to the Analytics endpoint of the Controller API, https://Controller_FQDN/api/v1/analytics/catalogs/metrics.
The output includes a list of available metrics and the dimensions associated with them, such as client.network.latency.count, http.request.bytes_sent, and so forth. Dimensions extend metrics by providing context for the metric values. To retrieve just the catalog of dimensions, send a GET request to https://Controller_FQDN/api/v1/analytics/catalogs/dimensions.
In many cases you’re not equally interested in all metrics. For example, you might only be interested in specific metrics, or seeing results for a specific NGINX Controller Environment (such as Production). Based on my history in IT, I frequently refer to this as “tuning the noise level of the source”. You can achieve this type of filtering in Splunk, but also by tuning the Forwarder. One side benefit of filtering metrics on the Forwarder side is reduced network traffic.
Here are a couple of examples to get you started.
Example 1: Specifying the Metrics to Send
In the JSON payload in Substep 3 of Step 3: Configuring the Data Forwarder with the NGINX Controller API, the selector field is empty. As a result, the data sent to Splunk includes all metrics from all managed NGINX Plus instances. What if you only want certain metrics? You can specify them with the names= identifier. In this example, only the client.response.latency.max, client.request.latency.min, and upstream.network.latency.total metrics are sent to Splunk (from all managed NGINX Plus instances).
{
    "metadata": {
        "name": "splunk-forwarder",
        "displayName": "Splunk - Metrics",
        "description": "Metrics forwarder going to Splunk HEC"
    },
    "desiredState": {
        "integrationRef": {
            "ref": "/platform/integrations/splunk-demo"
        },
        "streams": [
            {
                "inputDataType": "metrics",
                "outputFormat": "splunk_hec",
                "selector": "names=client.response.latency.max,client.request.latency.min,upstream.network.latency.total"
            }
        ]
    }
}
Example 2: Limiting the Data to Specific Dimensions
Limiting the data to specific metrics is useful, but very limiting. What if instead you wanted to only forward data for your Production environment, or a specific data center that you have defined as a location, or even one specific application or instance? This example sends only data from the NGINX Controller Application named trading.acmefinancial.net:
{
    "metadata": {
        "name": "splunk-forwarder",
        "displayName": "Splunk - Metrics",
        "description": "Metrics forwarder going to Splunk HEC"
    },
    "desiredState": {
        "integrationRef": {
            "ref": "/platform/integrations/splunk-demo"
        },
        "streams": [
            {
                "inputDataType": "metrics",
                "outputFormat": "splunk_hec",
                "selector": "filter=app='trading.acmefinancial.net'"
            }
        ]
    }
}
The selector field can combine multiple factors and use wildcards, as in these examples:
-
Wildcard representing all NGINX Controller Applications with acmefinancial in their names:
“selector”: “filter=app=’*acmefinancial*’”
-
Multiple dimensions:
“selector”: “filter=app=’trading.acmefinancial.net’ AND http.uri!=’/trading/login.php’”
-
Combination of specific metrics with dimensions:
“selector”: “names=http.request.count,client.latency.total&filter=app=’trading.acmefinancial.net’ AND http.uri!=’/trading/login.php’”
We Want Your Feedback!
We’re planning to add additional capabilities to support more data formats, improved filtering, events and alerts, and support for more authentication types. Also, we’re planning integrations with Datadog and F5 Beacon Visibility and Analytics. All of this is to ensure that we serve all of your business needs across the variety of tools you use. To guide the Data Forwarder roadmap, we’d love your feedback on the features and integrations you’re most interested in – let us know in the comments.
If you want to take NGINX Controller for a spin, request a free trial or contact us to discuss your use cases.
The post Introducing the NGINX Controller Data Forwarder with Splunk Integration appeared first on NGINX.
Source: Introducing the NGINX Controller Data Forwarder with Splunk Integration



Leave a Reply