In today’s world, having a scalable and reliable web infrastructure is crucial to your site’s success. Monitoring NGINX Plus performance and the health of your load-balanced applications is critical, and acting on these metrics enables you to provide a reliable and satisfying user experience. Knowing how much traffic your virtual servers are receiving and keeping an eye on error rates allows you to triage your applications effectively.
NGINX Plus includes enterprise-ready features such as advanced HTTP and TCP load balancing, session persistence, health checks, live activity monitoring, and management to give you the freedom to innovate without being constrained by infrastructure. The live activity monitoring feature (implemented in the NGINX Plus Status module) makes it easy to get key load and performance metrics in real time. The large amount of useful data about the traffic flowing through NGINX Plus is available both on the built-in dashboard and in an easy-to-parse JSON format through an HTTP-based API.
There are many effective ways to use the data provided by the live activity monitoring API. For example, you might want to monitor a particular virtual server’s upstream traffic and autoscale Docker containers using the NGINX Plus on-the-fly reconfiguration API. You might want to dump the metrics directly to standard out and write them to a log file so you can send metrics to an Elasticsearch or Splunk cluster for further monitoring and analysis. Or perhaps you want to collect and send the API data to a data aggregator like statsd or collectd for other graphing or logging purposes.
This blog post describes how to store and index JSON-format metrics from the live activity monitoring API using Elasticsearch, process them using Logstash, and then search and visualize them in Kibana (the ELK stack). To make it easier for you to try out ELK and NGINX Plus together, an example demo, ELK_NGINX_Plus-json, has been created to accompany this blog post and provides step-by-step instructions.
This blog doesn’t discuss the open source NGINX software directly, but if you want to use the ELK stack to ingest, analyze, and visualize access logs from open source NGINX, you can look at these examples: ELK_NGINX and ELK_NGINX-json.
About the ELK Stack
Elastic provides a growing platform of open source projects and commercial products for searching, analyzing, and visualizing data to yield actionable insights in real time. The three open source projects in the ELK stack are:
- Elasticsearch – Real-time distributed search and analytics engine that indexes and stores the logs. You can perform any combination of full-text search, structured search, and analytics. . For information about using NGINX Plus to load balance Elasticsearch nodes, see NGINX & Elasticsearch: Better Together.
- Logstash – Server component that processes incoming logs, allowing you to pipeline data to and from anywhere. This is called an ETL (for Extract, Transform, Load) pipeline in the Business Intelligence and Data warehousing world, and it is what allows you to ingest, transform, and store events in Elasticsearch.
- Kibana – Web interface for searching and visualizing logs. It leverages Elasticsearch search capabilities to analyze and visualize your data in seconds.
Ingesting NGINX Plus Logs into Elasticsearch with Logstash
To set up Logstash to ingest data, you need to create a configuration file that specifies where the data is coming from, how it’s to be transformed, and where it is being sent. Below is a sample Logstash config file for ingesting logs from the live activity monitoring API into Elasticsearch:
- The first section uses Logstash’s file input plug-in to read in the logs.
- The second section uses the match configuration option from the date filter plug-in to convert the timestamp field in NGINX Plus log entries into UNIX_MS format.
- The third section uses the elasticsearch output plug-in to store the logs in Elasticsearch.
input {

    file {

      path => “/nginxlogfile.log”

    }

}
filter {

  date {

    match => ["timestamp", "UNIX_MS"]

  }

}
output {

  stdout { codec => dots }
  elasticsearch {

    host => "localhost"

    protocol => "http"

    cluster => "elasticsearch"

    index => "nginxplus_json_elk_example"

    document_type => "logs"

    template => "./nginxplus_json_template.json"

    template_name => "nginxplus_json_elk_example"

    template_overwrite => true

  }

}
For more information about creating Logstash configuration files, see Configuring Logstash. If you are looking for a lightweight agent that reads status from NGINX periodically, be sure to check out nginxbeat.
Displaying the Data using Kibana
Once the data is indexed into Elasticsearch, you can display the data in Kibana by accessing http://kibana-host:5601 in a web browser. You can interactively create new visualizations and dashboards to visualize any of the metrics exposed by the Status module. For example, you can look at:
- Connections accepted, dropped, active, and idle
- Bytes sent and received in each server zone
- Number of health checks failed
- Response counts, categorized by status code and upstream server
An example showing all the NGINX Plus metric names indexed in ELK is available at nginxplus_elk_fields.
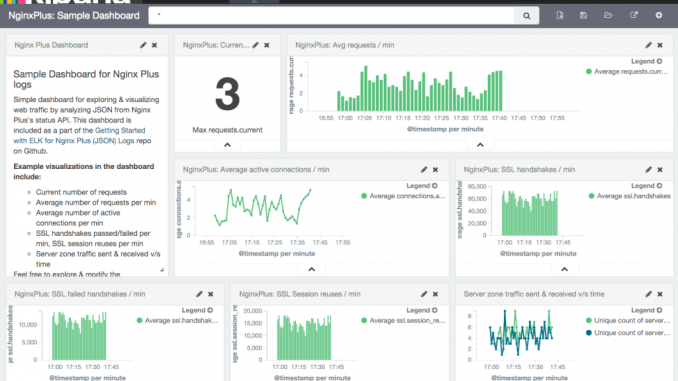
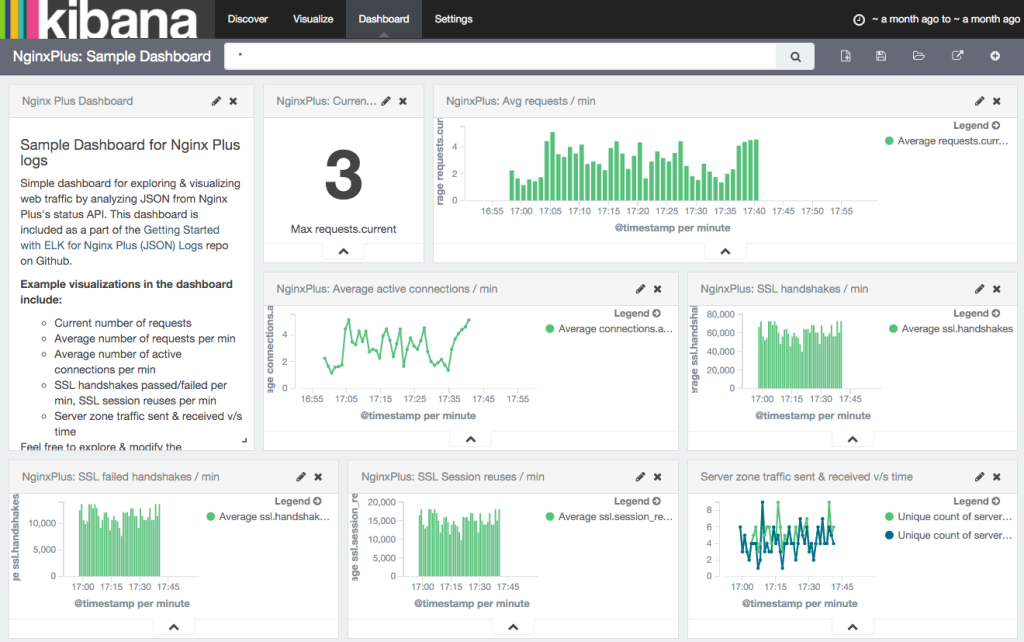
The sample dashboard above, created using Kibana, shows some useful visualizations like average number of requests per minute, average active connections per minute, SSL handshakes per minute, and so on.
Summary
Using the ELK stack to collect, visualize, and perform historical analysis on logs from NGINX Plus live activity monitoring API provides some additional flexibility and more insight into the data. The statistical data you pull from NGINX Plus using ELK can help provide better logging, create automation around live activity monitoring, and create graphs or charts based on the performance history of NGINX Plus.
The post Monitoring NGINX Plus Statistics with ELK appeared first on NGINX.
Source: nginx


Leave a Reply