Introducing Custom Dashboards in NGINX Amplify
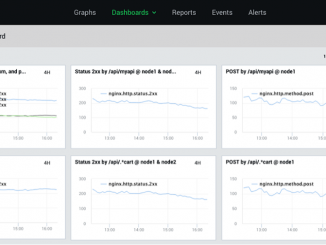
Introducing Custom Dashboards in NGINX Amplify We are very excited to announce the addition of custom dashboards to NGINX Amplify, our SaaS-based tool for monitoring and managing NGINX. Now you can create your own dashboards populated with highly customizable graphs of NGINX and system-level metrics. As you can see, not only can the metrics be summed (or averaged across several NGINX servers), but it is also possible to create additional “metric dimensions”, for example, reporting the number of POST requests for a specific URI. NGINX Amplify is currently in private beta. We want to thank everyone who provided their feedback and various suggestions. Everything you’ve told us so far has been incredibly helpful. If you haven’t yet, sign up for the private beta today. Now, let’s dig deeper into the custom dashboards. Using Custom Dashboards In NGINX Amplify With this new feature, you [ more… ]


