Introducing Custom Dashboards in NGINX Amplify
We are very excited to announce the addition of custom dashboards to NGINX Amplify, our SaaS-based tool for monitoring and managing NGINX. Now you can create your own dashboards populated with highly customizable graphs of NGINX and system-level metrics.

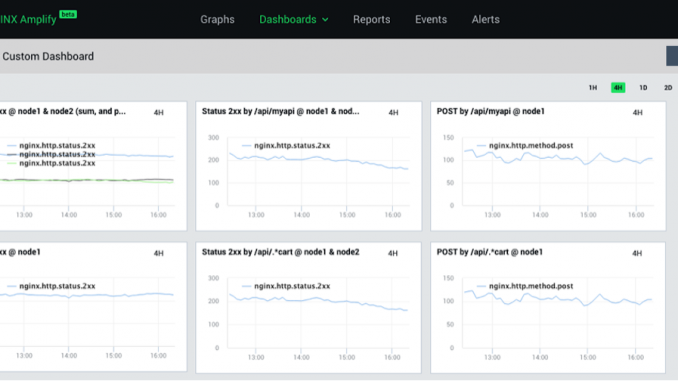
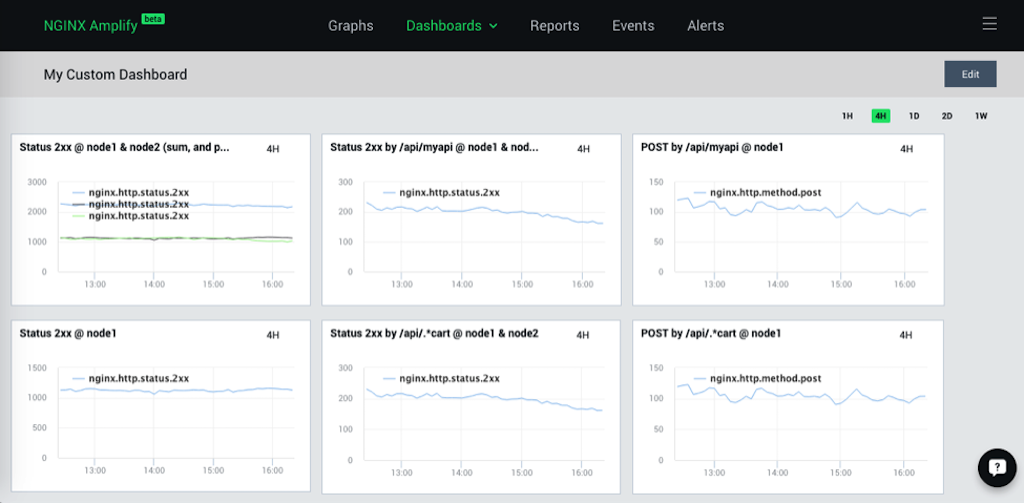
As you can see, not only can the metrics be summed (or averaged across several NGINX servers), but it is also possible to create additional “metric dimensions”, for example, reporting the number of POST requests for a specific URI.
NGINX Amplify is currently in private beta. We want to thank everyone who provided their feedback and various suggestions. Everything you’ve told us so far has been incredibly helpful. If you haven’t yet, sign up for the private beta today.
Now, let’s dig deeper into the custom dashboards.
Using Custom Dashboards In NGINX Amplify
With this new feature, you can build bespoke sets of graphs for the metrics that NGINX Amplify collects.
Several use cases for a custom set of graphs that immediately come to mind are:
- Checking NGINX performance for a particular application or microservice, e.g. based on the URI path
- Displaying metrics per virtual server
- Visualizing the performance of a group of NGINX servers – for example, front-end load balancers or an NGINX edge caching layer
- Analyzing a detailed breakdown of HTTP status codes per application
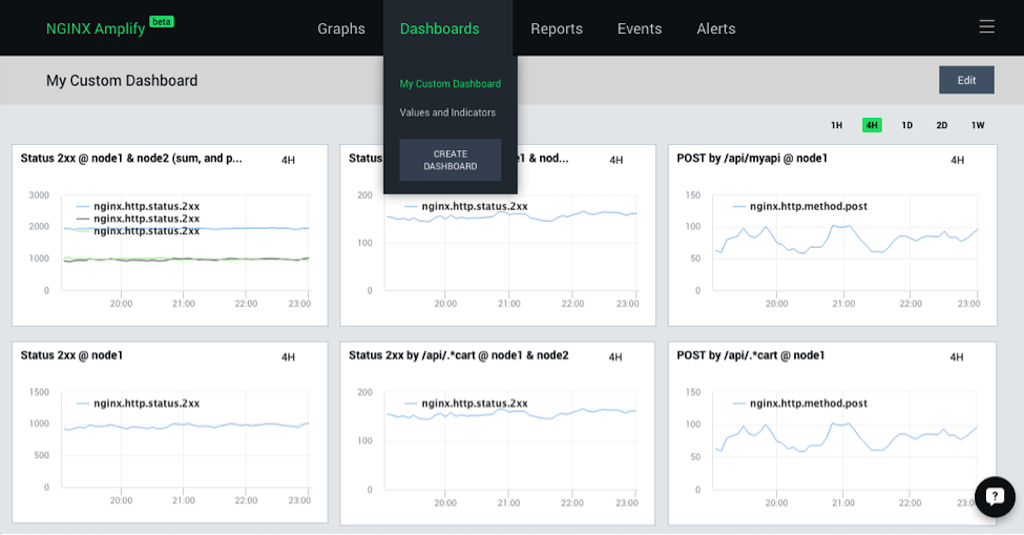
To create a custom dashboard, click CREATE DASHBOARD on the Dashboards drop-down menu, as shown in the screenshot above. Then click Edit in the upper right corner to start editing the dashboard. You can then add graphs and simple values to the dashboard.
The following dialog box appears:
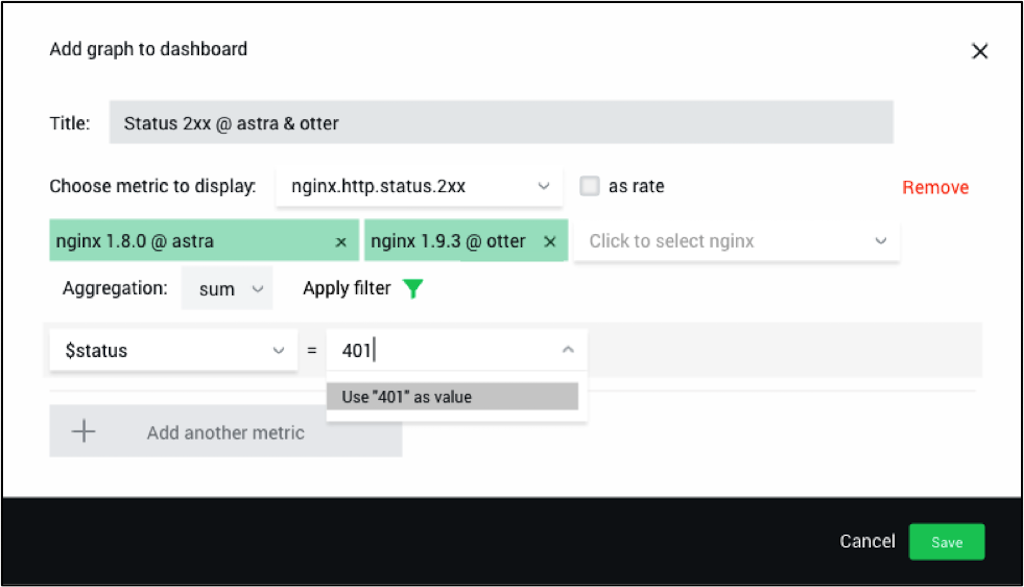
To add a graph, perform these steps:
- First pick one or more metrics of interest. You can combine multiple metrics on the same graph using the Add another metric button at the bottom.
- After the metric is selected, NGINX Amplify lists the objects for which it has already observed this particular metric. Select one or multiple objects here. In the example above the objects are the NGINX instances on the hosts called astra and otter.
- Select either sum or avg as the aggregation function.
- Last but not least, filtering is also available for NGINX metrics. If you click on Apply filter, you can then add multiple criteria in order to define specific “metric dimensions”. In the screenshot above, we are filtering by HTTP status code
401. - Click Save when you’re done, and the graph is added to the dashboard. Obviously you can then edit the graph specs, move it around, resize, stack the graphs on top of each other, etc.
By default, we don’t really store all of the possible metric dimensions in the NGINX Amplify backend. A particular filter starts to slice the metric according to the specified dimensions only after the graph is created. Hence, it can be a while before the “filtered” metric is displayed on the graph – the end result depends on how quickly the log files are being populated with the new entries, but typically you will see the first data points in under 5 minutes.
How Custom Dashboards Work in NGINX Amplify
Below is a little bit more technical detail about how it all works.
Because NGINX Amplify is not a log analyzer, we had to enhance the Amplify Agent in order to implement additional slicing for metric dimensions. We’ve added capabilities in the Amplify Agent that enable it to parse the NGINX access logs on-the-fly and extract all the necessary metrics without sending the raw log entries elsewhere. Moreover, the Amplify Agent can actually understand custom log formats automatically, and start looking for various newly defined metric dimensions.
In a sense, what we have now in the Amplify Agent is a combination of real-time log analytics and collection of the standard metrics (i.e., metrics from the stub_status module). Again, the Amplify Agent does only the real-time log processing, and always on the same host where it is running.
Metric filters can be really powerful. By using the filters and creating additional metric dimensions, it becomes possible to build highly granular and very informative graphs. Bear in mind, though, that to enable the Amplify Agent to slice the metrics you must add the corresponding log variables to the active NGINX log format.
In addition to all of the above, we also wanted to describe the technical challenges that we had to overcome when implementing custom dashboards.
First of all, we have to deal with the many kinds of NGINX builds out there. Many people install NGINX from packages they find with their OS distribution, from our native repository at nginx.org, or maybe even from a third-party repository. Overall, there are many versions and many different flavors of NGINX builds in the wild. Automatically identifying a particular running binary and finding all its metrics is sometimes a very tricky thing to do. If you don’t see the Amplify Agent successfully detecting your perfectly valid NGINX instances, give us a buzz (through the Intercom icon at the bottom right of the NGINX Amplify screen) and we’ll investigate it.
For NGINX metric collection per se we had to standardize on pretty much just two common denominators – stub_status and the log files. We also collect some additional metrics using psutil(). If you don’t see a particular metric being collected, be sure to check the docs, and feel free to ask for help as well.
One of the hardest parts for us when implementing the custom dashboards has been designing the Add graph to dashboard dialog box. We really tried to make it as simple as possible, but given the complexity of the underlying metric collection mechanisms, your mileage may vary. Please feel free to send us any kind of observations and suggestions in regards to the usability of the graph configuration mechanism.
Last but not least, the Amplify Agent and the backend code had to be seriously revamped to support new metric breakdowns and additional metric dimensions. Sometimes bugs slip past our internal QA, so bear with us for a little while until it all settles.
Why Custom Dashboards?
When we first started to think about the graphs in NGINX Amplify, we had quite a few challenges and tradeoffs to manage. We ended up with an initial plan to implement a scalable metric collection and just the core set of graphs first – in order to begin with something that would be useful for basic graphing of NGINX performance.
As it turns out, a lot of our beta users really appreciated the ability to easily see what their NGINX servers are doing, as well as identify and pinpoint various performance related problems.
However, as soon as we launched the private beta in November 2015, we also started to get more and more requests for somewhat more powerful graphing capabilities. In particular, a number of people immediately asked how they could build individual graphs for virtual hosts on their NGINX instances – and not just instance‑wide cumulative graphs.
Summary
There are many things that we’d like to improve in the dashboards going forward. We ponder a lot of additional details like graph design, better labeling, color themes, copying graphs between dashboards – and most certainly dashboard‑creation wizards. If you have your own ideas, send them over!
We hope you’ll like the new dashboards and will dig out even more useful information about the lives of your NGINX servers!
As always, your feedback is highly valued, and very much appreciated.
The post Introducing Custom Dashboards in NGINX Amplify appeared first on NGINX.


Leave a Reply