Announcing the Public Beta Release of NGINX Amplify

We are proud to announce the free public beta release of NGINX Amplify, our new tool for monitoring NGINX and NGINX Plus. With NGINX Amplify you get visibility and control of NGINX and the applications it delivers. You can use it to quickly troubleshoot and resolve health and performance issues within your applications and across your infrastructure. NGINX Amplify includes powerful features such as recommendations for performance and security improvements, a customizable server monitoring dashboard, and a configurable alerting system. Register for a live webinar to be held on July 13, 2016 at 10:00 AM PDT to learn more and see a demo.
Click here to sign up for free today.
NGINX Amplify is easy to use, and takes only 5 minutes to set up. With NGINX Amplify you get:
- Performance and security recommendations – NGINX Amplify thoroughly analyzes your NGINX configuration and recommends changes to improve performance and security. Each recommendation includes the line number of the cited configuration directive, explains the problem, and suggests a way to resolve it.
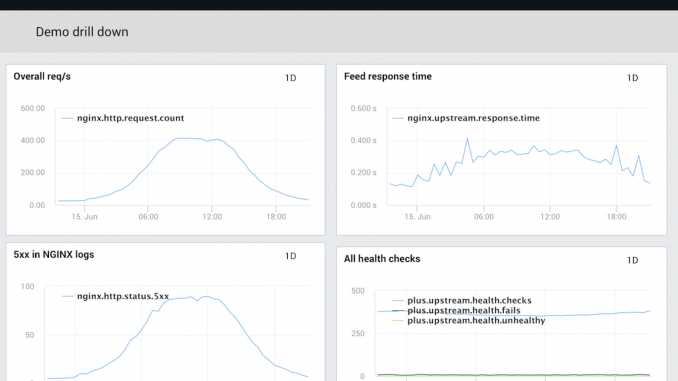
- Real-time monitoring – NGINX Amplify is a “single pane of glass” for monitoring all of your NGINX instances. It collects hundreds of metrics from NGINX, log files, and the operating system, and provides a highly customizable interface to display them (pictured above). The metrics can be aggregated over a cluster of NGINX instances for a high-level overview or filtered down to track performance of individual APIs.
- Configurable alerts – NGINX Amplify sends email alerts when systems need attention. Any of the metrics collected by NGINX Amplify can be used as criteria for sending alerts. For example, an alert can be generated with the number of
5xxerrors crosses a threshold you set.
Given our unique position as the web server, frontend proxy, and load balancer for our user’s applications, we believe that NGINX Amplify is a strong complement to existing application performance and uptime monitoring tools. NGINX Amplify works by way of a small open source agent installed on each of your NGINX or NGINX Plus endpoints. The agent collects metrics for analysis and visualization, and that data is combined with the existing information collected natively within open source NGINX and NGINX Plus to give you a holistic view into the health of your applications.
We invite all NGINX and NGINX Plus users to sign up now to take advantage of this opportunity to analyze and take greater control of your applications. By participating in the NGINX Amplify public beta, you can begin visualizing key metrics within minutes and receive actionable insights to improve the performance and security of your apps.
Strong Feedback from Our Private Beta
NGINX Amplify was made available through a private beta last November. NGINX enthusiasts and those with strong application monitoring needs were the first to join our private beta; and as we enter this public beta, we expect our user base to grow rapidly.
Here are what some of our users have said about NGINX Amplify:
“… [in one incident] our network connectivity suffered, and the servers were cut for a short time from the Internet. Our own monitoring didn’t reflect that, and if NGINX Amplify hadn’t noticed and alerted us, we would have been unaware of that fact.”
“The Reports page is helpful for providing a quick overview of the server configuration, and the static analysis has helped us recognize missing configuration settings.”
“NGINX Amplify has helped me solve immediate issues with the Static analysis section of the Reports page.”
NGINX Amplify In Detail
Performance and Security Recommendations
NGINX Amplify performs static analysis of your NGINX and NGINX Plus configurations. The Reports page recommends changes to enhance the performance and security of your NGINX deployment. Each recommendation includes the file and line number for the cited configuration directive, explains the potential problem, and suggests a way to resolve it.
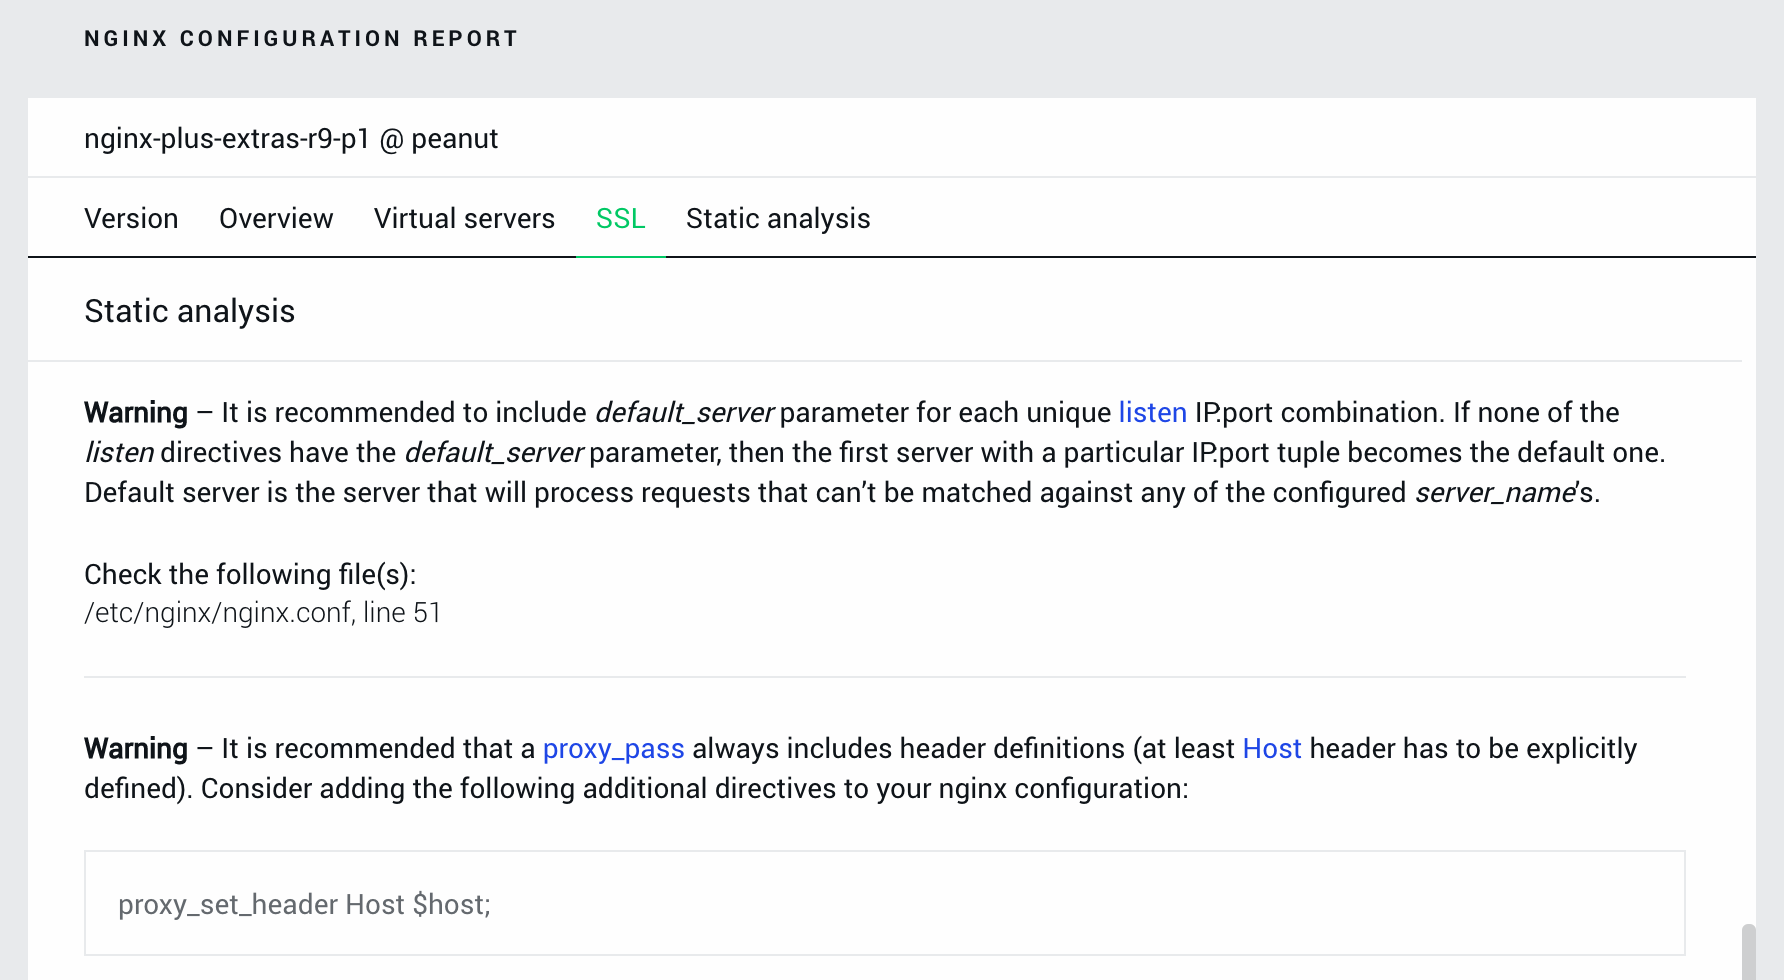
The first example in the screenshot points out a common misconfiguration that can lead to unpredictable behavior when a request for an unknown virtual server comes in.
NGINX Amplify also detects misconfigurations that can impact performance. For example, completely disabling buffering of responses from proxied servers can degrade performance, while disabling buffering to disk may improve it. Users quite commonly confuse the two and disable all buffering unnecessarily. NGINX Amplify spots this misconfiguration and suggests what is typically intended.
NGINX Amplify further identifies potential security issues in the configuration and provides recommendations for fixing them. For example, NGINX Amplify suggests restricting access for metrics to prevent unauthorized access to key server data.
Real-Time Monitoring
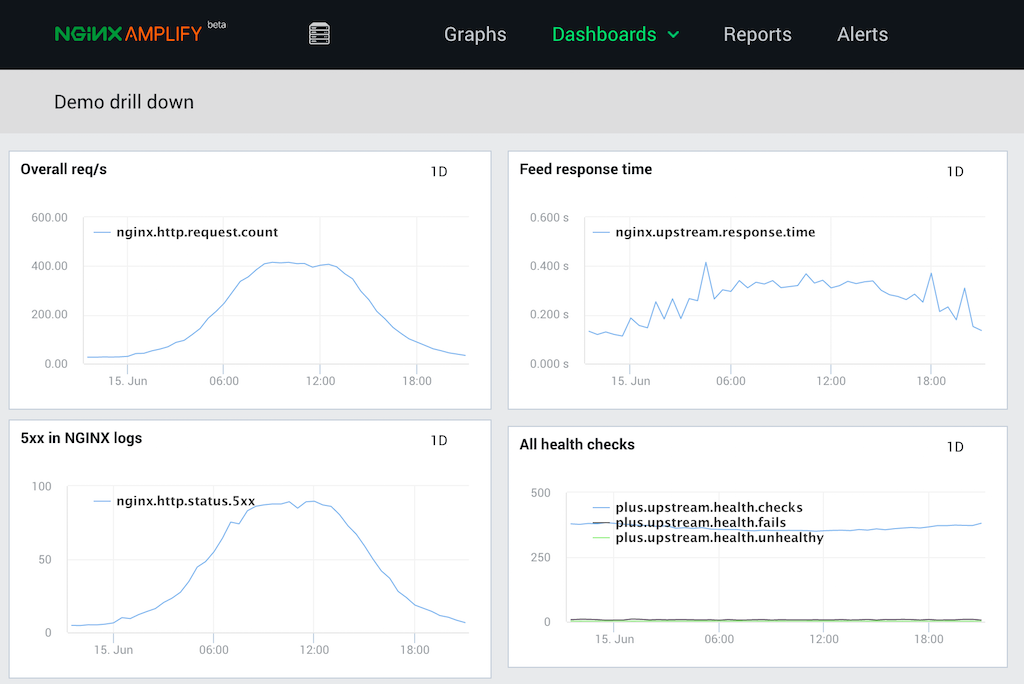
With NGINX Amplify you can display related metrics in a “single pane of glass” under the Dashboards tab. Among the statistics you can display:
- Individual metrics – for example, proportion of CPU capacity utilized by each individual server
- Aggregated metrics, such as total throughput across all NGINX instances
- Metrics related to the performance of app servers, including response times
NGINX Amplify stores NGINX monitoring data for a week so that you can do historical analysis.
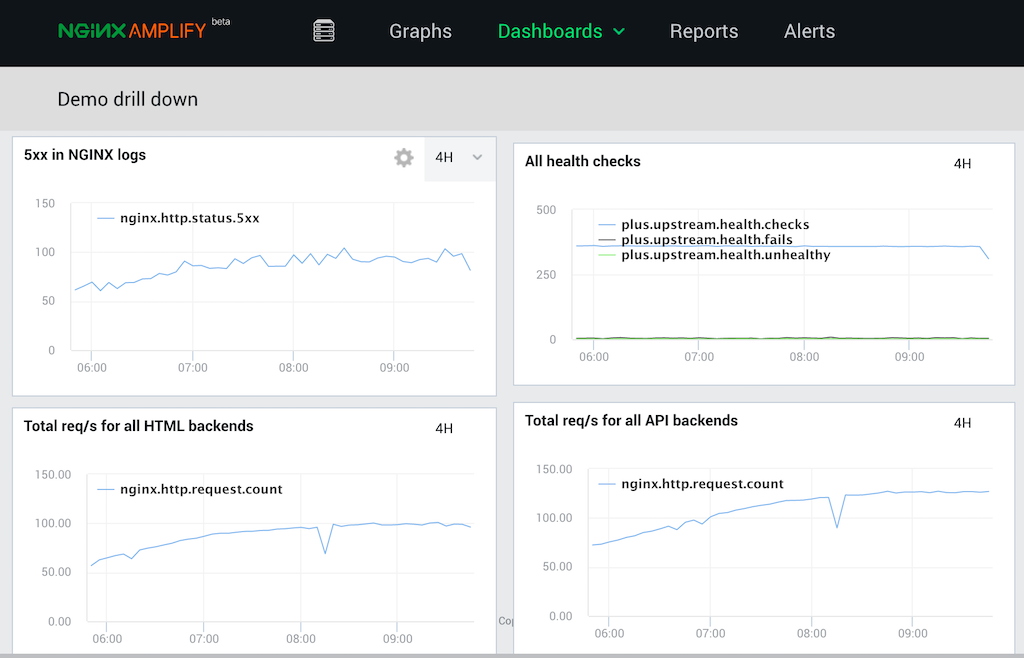
NGINX Plus collects additional metrics related to the performance of backend application servers. NGINX Plus users benefit from visualizing these metrics in NGINX Amplify and looking back at them historically:
- Workload per backend application server, including requests, responses, and throughput
- Health of each backend server, including error counts and how often each server has failed health checks
- Uptime, traffic weight, and other critical information
Alerts
You can define alerts so that NGINX Amplify notifies you on the Alerts page when systems are not healthy. NGINX Amplify collects a wide range of metrics from monitored systems that can be used as criteria for generating an alert.
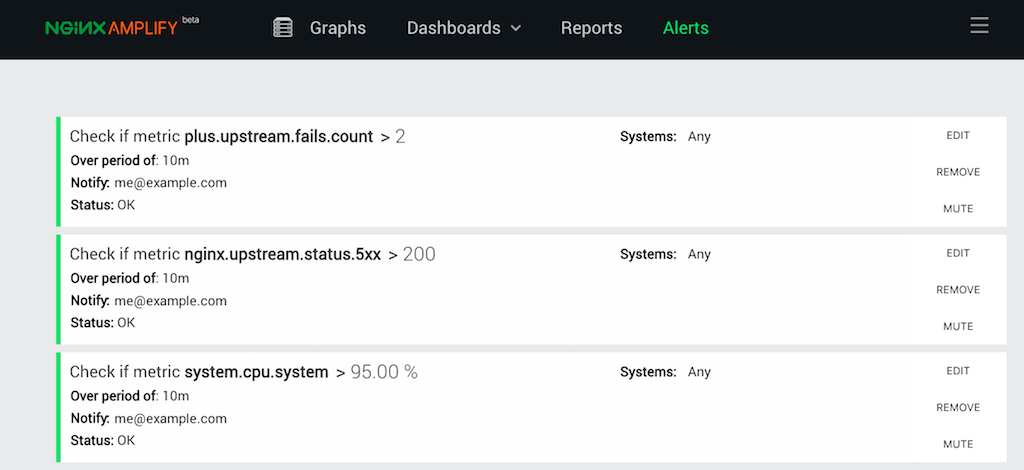
The screenshot shows an alert where NGINX Amplify emails [email protected] when any system’s CPU goes over 95% utilization for 5 or more minutes, which indicates the server is overloaded. You can designate any email address, for example your PagerDuty email routing.
After the initial alert, NGINX Amplify sends digest messages every 30 minutes until all errors are cleared.
Summary
NGINX is one of the most critical components in your application delivery infrastructure. NGINX Amplify helps ensure that NGINX and your application are healthy and performing at peak capacity. We invite everyone is to sign up today for our free public beta.
The post Announcing the Public Beta Release of NGINX Amplify appeared first on NGINX.


Leave a Reply