Debug the DOM in Visual Studio Code using Elements for Microsoft Edge
Over the past few months, we’ve been working closely with web developers to understand how to simplify your workflows by building on our new Chromium-powered DevTools foundation for the next version of Microsoft Edge. One consistent theme we heard in these conversations is that you want to spend more time working with code in your favorite editor. Given you can already debug Edge from VS Code, the next logical step is to integrate the most-used browser tool, Elements, into VS Code, as well.
You can try this out today in our new preview VS Code extension, Elements for Microsoft Edge. This extension is an initial preview meant to better understand the issues you have manipulating and debugging HTML and CSS across browser tools and your editor. To get started, download a Microsoft Edge Insider preview build then install the Elements for Microsoft Edge extension.
Why Elements?
We’ve heard from developers that it’s frustrating to mix different workflows when trying to accomplish the same job across the DevTools and IDE. Specifically, we identified three areas that have significant opportunity for improvement:
- Quickly bringing changes back to source code when modifying CSS in the DevTools
- Minimizing the chance you lose changes when making multiple modifications to HTML/CSS in the DevTools
- Quickly making a change to source code and seeing that change reflected in the browser

The Elements for VS Code extension is our first step toward simplifying these workflows by enabling you to inspect and debug the DOM directly from within VS Code and see the impact of changes to the page in real time. This experience starts with the Elements tab because it is the most-used tool in the family of Microsoft Edge DevTools, and with VS Code because it’s by far the most-used text editor by web developers today.
Getting started with Elements for Microsoft Edge
To try the Elements for Microsoft Edge extension, first install a Dev or Canary channel preview build of Microsoft Edge then install the Elements for Microsoft Edge VS Code extension from the VS Code Marketplace.
Once both are installed, open VS Code to the project you want to work on and you’ll see a new view added to the side bar: ![]()
Clicking this will take you to the targets list that shows any debuggable instances of Microsoft Edge. If you don’t currently have a debuggable target open, you can click the plus (+) button to launch a new instance and attach to it. Alternatively, you can use a task in your launch.json file, just as you might with other kinds of debugger extensions.
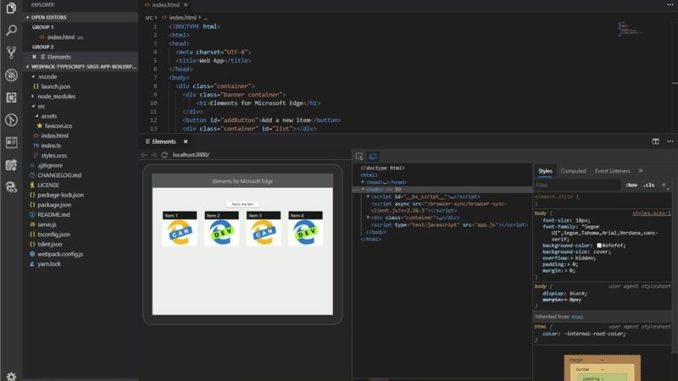
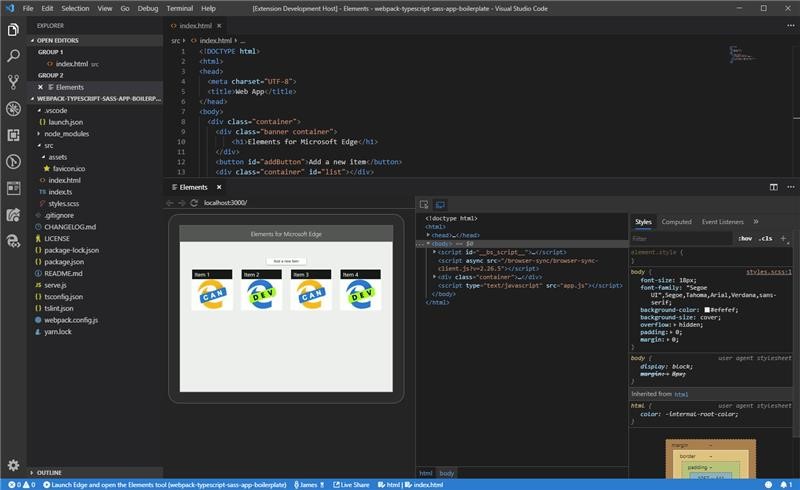
Attaching to an instance of the browser will open the new Elements tool panel showing you the HTML document structure and CSS styling information for your site or app.
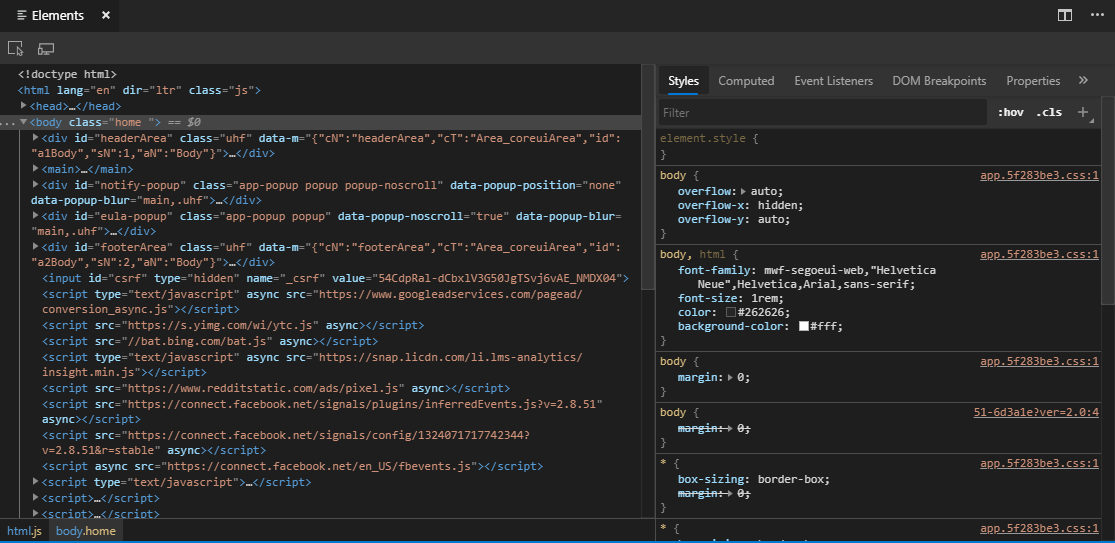
If you regularly use the Microsoft Edge DevTools or other Chromium-powered browser tools, this window should look familiar. You can navigate the structure of the DOM, see styling information for the selected element, change CSS values and element attributes, and anything else you are used to from the in-browser Elements tool.
To see a live view of your website inside the Elements extension, just press the “Toggle screencast” button.
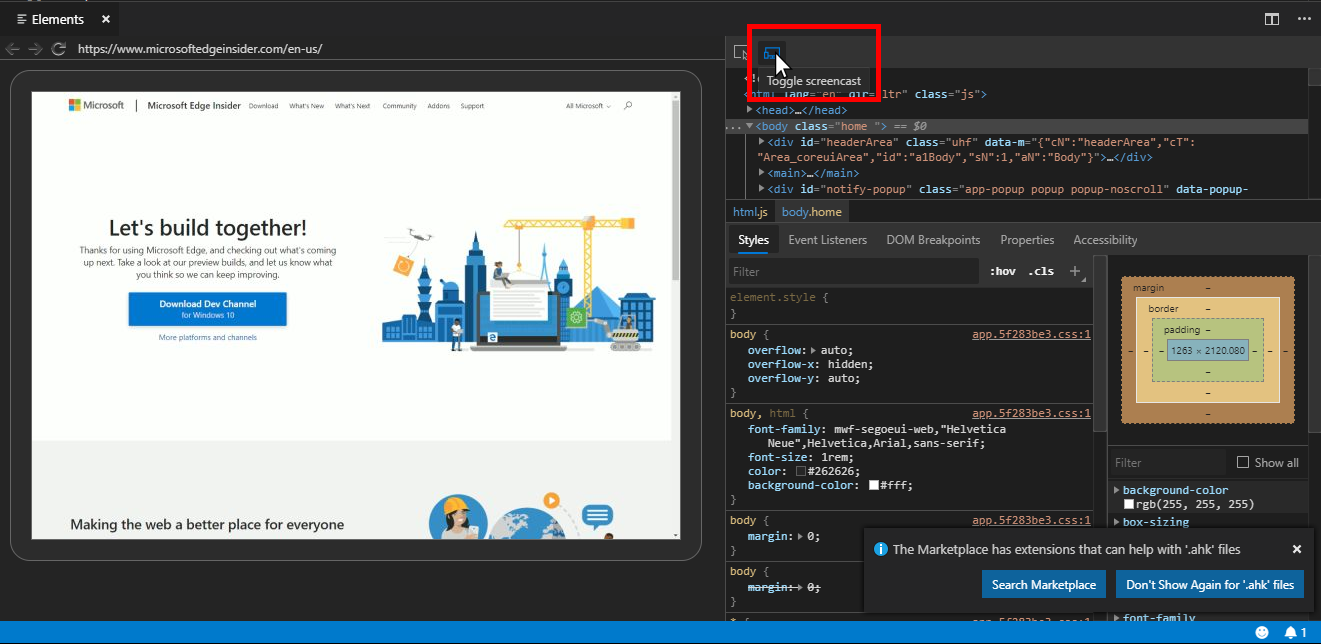
This view will update live as you make changes to the CSS and HTML, so you don’t have to leave VS Code to see how changes affect the layout of your site.
What to expect
One of our principles is to iterate rapidly in partnership with real customers. As we investigate potential DevTools solutions, we intend to ship functional prototypes in the open so we can get your early feedback.
The Elements for Microsoft Edge extension is our first such prototype, meaning it won’t be perfect and we expect to learn a lot along the way. We intend to move forward largely based on your feedback to ensure any solutions we ship and maintain are good fits for the Microsoft Edge DevTools and VS Code communities.
We do not intend to migrate the Microsoft Edge DevTools out of the browser and fully into the IDE. In general, we believe that there are many opportunities to integrate browser tools across other aspects of your workflow but we remain committed to providing best-in-class and separate browser tools, as well. Where integration makes sense we want to build it thoughtfully, moving from simple prototypes to a more cohesive solution that feels right with the hosting environment.
You can visit our GitHub repo for examples of using the tools and to submit any issues you encounter along the way. Feel free to reach out to us on Twitter, as well: @edgedevtools.
We’re excited to hear what you think—happy coding!
– Paul Gildea, Program Manager, Microsoft Edge DevTools
The post Debug the DOM in Visual Studio Code using Elements for Microsoft Edge appeared first on Windows Blog.
Source: Debug the DOM in Visual Studio Code using Elements for Microsoft Edge


Leave a Reply