
Fun with Health Checks using NGINX Plus and Docker

This post is adapted from a presentation at nginx.conf 2017 by Rick Nelson, Head of the Sales Engineering Team at NGINX, Inc.
You can view the complete presentation on YouTube.

My name is Rick Nelson, and I head up the pre-sales engineering team here at NGINX.
Today, I’m going to talk about some different ideas about how you can use health checks – the active health checks in NGINX Plus – when you need to worry about system resources, and specifically, when you’re running in containers.

I assume, since you’re here at an NGINX conference, that most of you know about NGINX Open Source. You may be aware that NGINX Open Source does have a version of health checks, but the health checks are passive.
When NGINX Open Source sends a request, or tries to open a connection to an upstream server – if it has an error, it will notice, and can mark the server as down.
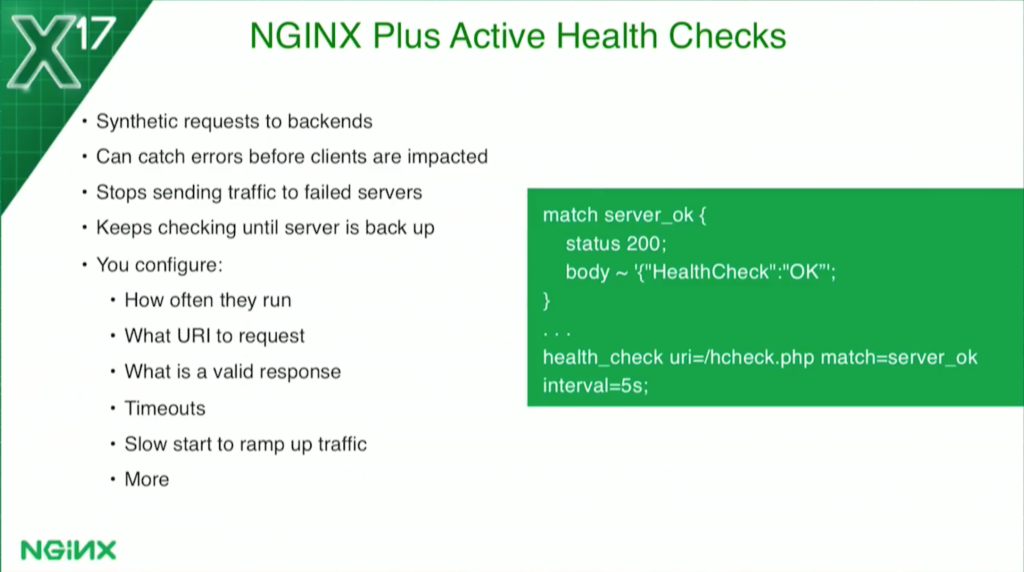
NGINX Plus brings active health checks. NGINX is going to be continually checking the backends to see if they’re healthy.
NGINX active health checks are very configurable. It’s actually running synthetic transactions, completely separate from any actual client traffic to the backends. You can figure out what URI to hit, how often you run them, and what a proper response status code is.
For example, if your servers have some warm-up time – when they come back to health, they may respond to the health check. But perhaps they’re warming up caches and other things, and if they get slammed with load, they’ll fall over again.
There’s a slow start feature where you can tell NGINX to ramp the load up slowly so it doesn’t get hammered when the servers first come back to life.
Once a health check fails, it’ll get marked as down. NGINX will stop sending any actual traffic to it, but it’ll keep checking, and it won’t send traffic to it again until it has actually verified that the other machine is up.
For the use cases today, there could be one where you’re rung in a container. You have a service where you’re very concerned about the CPU utilization, or maybe it’s the memory utilization, or maybe you have some really heavy requests and your backend can only handle so many requests at a time. These are the three use cases I’m going to talk about today.

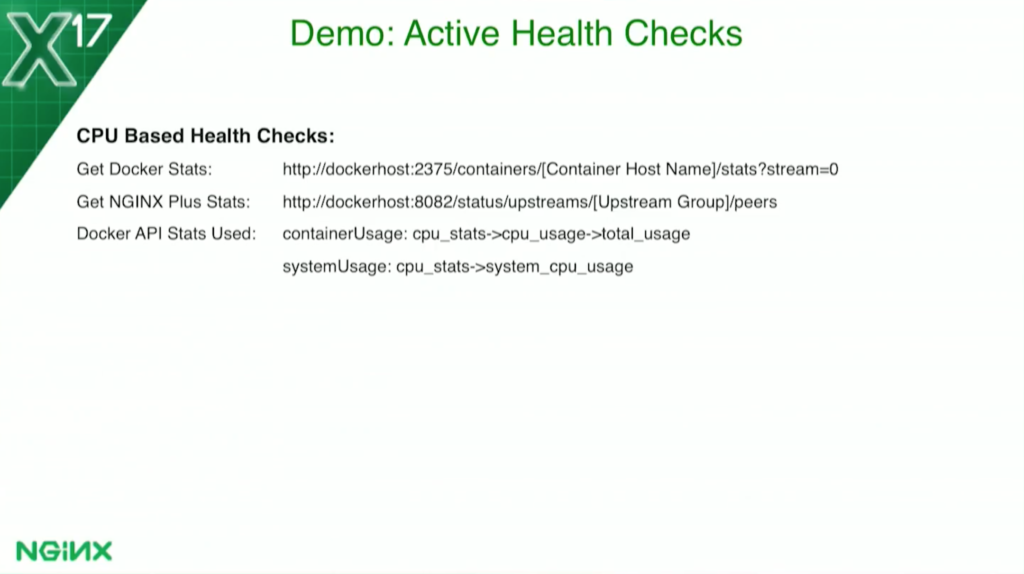
When it comes to getting system stats in a Docker container, you’ll find that you can’t really get them very easily from the container itself, so you use the Docker API. I’m using that for both my CPU- and my memory-based health checks.
I’m also using NGINX Plus status API because, when I’m looking at the CPU utilization, I actually need to know how many containers there are. I’ll talk about that in a little more detail in a minute.
I’ll be showing you a demo in a few minutes.
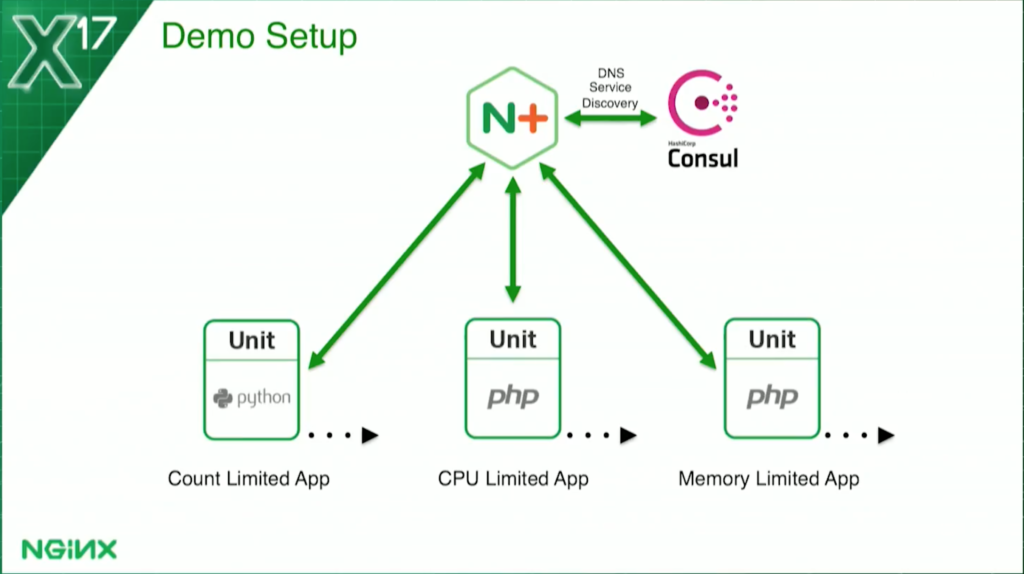
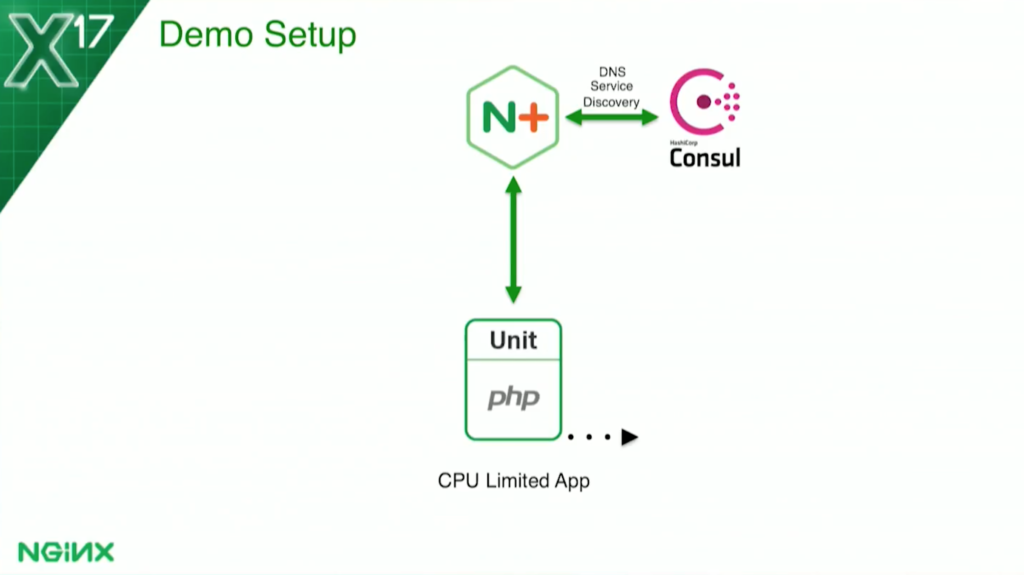
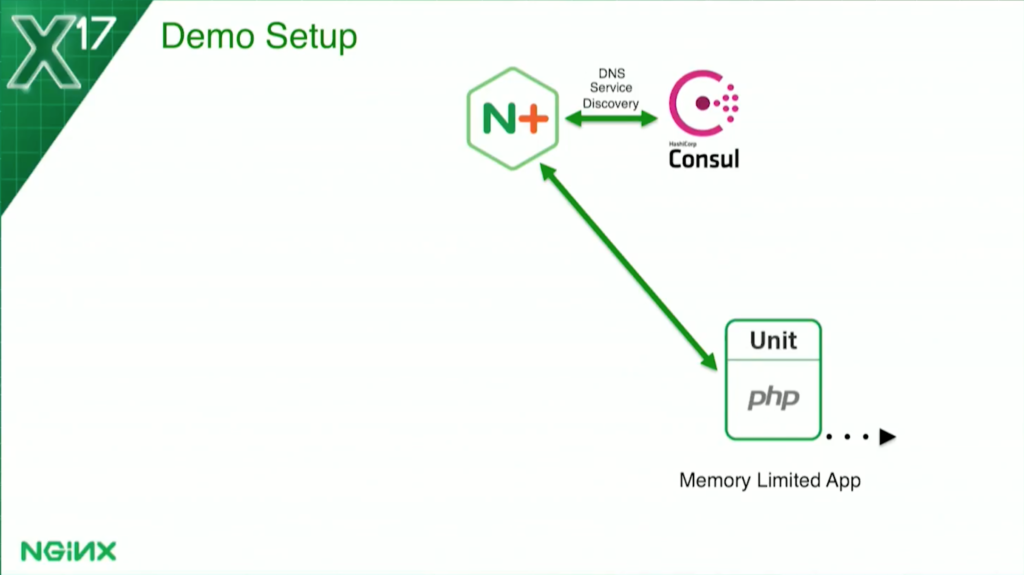
This is the basic config. I’ve got NGINX Plus at the frontend, load balancing three sets of upstreams. They’re all running NGINX Unit, which you’ve been hearing about over the last couple of days.
The count-based health check – in the ones limited by how many requests can be processed at a time – is running Python. The other two, my CPU and memory utilization checks, are running PHP. They’re all running Unit.
For service discovery, so NGINX Plus knows how many containers to load balance, I’m using Consul.
There was an earlier presentation today from Zendesk, and Cassiano Aquino was talking about Consul. It’s a very common thing to integrate Consul and NGINX, especially NGINX Plus, when you’re doing service discovery.
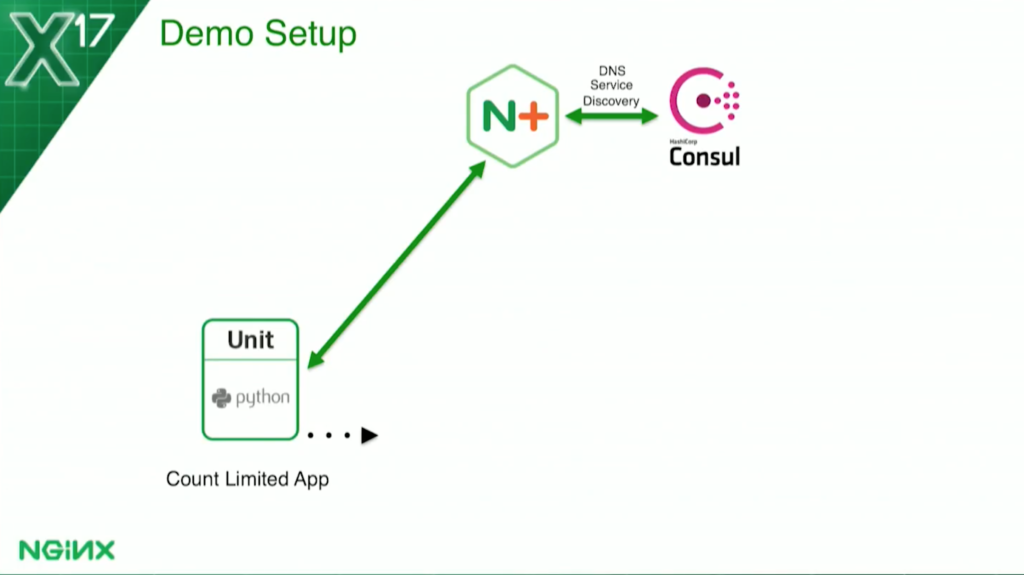
For the count-based health check I’m looking at in this case: the service is so heavyweight, it can only handle one request at a time. I have to come up with a solution so that, basically, when it’s processing a request, it becomes unhealthy. That will cause NGINX Plus to stop sending any requests to it. When it’s done, it becomes healthy again and NGINX brings it back into the load balancing rotation.
For the CPU-based health check, I’ve set a threshold of 70 percent of the Docker host utilization for the application.
For the memory-based health check, I’m actually limiting each container to 128 MB. Then I tell the health check: if the container is using more than 70 percent of that, it marks it as unhealthy.
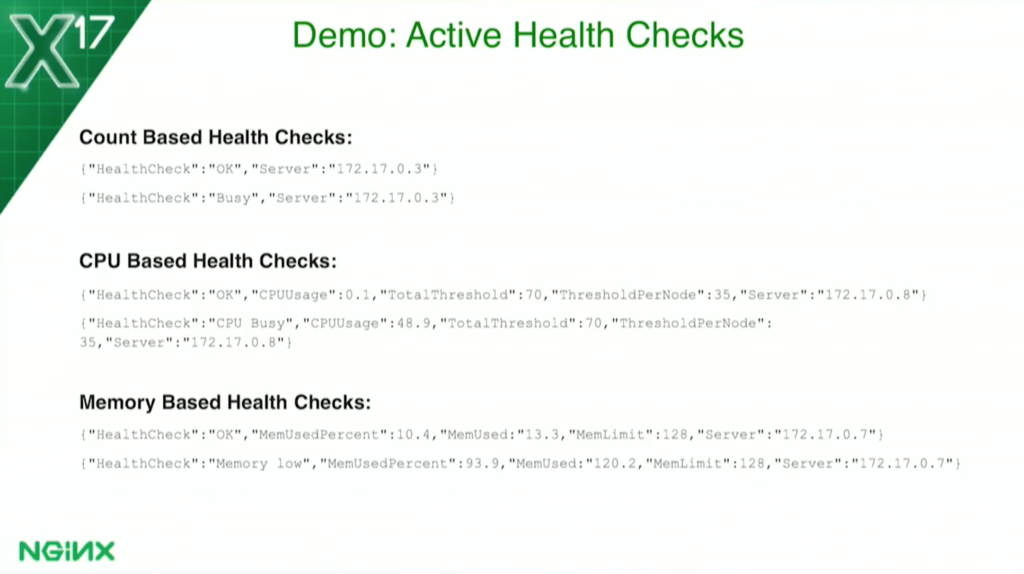
A little more detail: they all return JSON data and they all return “Healthcheck” “OK” if they’re successful. If they’re not successful: for the count-based health check, it’ll say it’s busy; for the CPU-based health check, it’ll say CPU busy; for the memory-based health check, it’ll say memory low.
The CPU- and memory-based health checks will actually display the memory usage with the threshold they were calculated on, and so forth. But anything that’s not OK is a failure. OK is a success.

Let’s go into a little more detail. For the count-based health check, I’m using a simple semaphore file. When a request is received, the application will create the file /temp busy. The health check will look for the existence of that file. If it sees it, it marks it unhealthy. When the application finishes it, it removes the file. The health check now sees the file is not there, and it comes back to health. It’s very straightforward, very simple.
The CPU-based health check is a little more complicated. I don’t know if you’ve ever gone into a container running the top command in a Docker container. You’ll find out that you’re seeing the Docker host. You can run in all five containers, and you see that they all say the same thing.
When I first went to do this – I actually discovered that I’d never actually looked before. I said, Oh, that’s not good. But the Docker API does allow you to get that.The container actually calls the host on the Docker API, and it can gather statistics about that container.
For each container, it says, “This container is using this much of the Docker host.” I set my threshold at 70 percent to say, “This whole application is allowed 70 percent of the Docker host.”
Again, I use the Docker API. I have to make two calls, one second apart, to gather the data. To get the CP utilization for the container, I use the NGINX Plus status API. To find how many containers there are, I divide that threshold by the number that tells me how much each container can have. For example, if I have one container, that container can use 70 percent of the host, but if I have two containers, then each one can get 35 percent, and so on. As it scales, each one would be allowed a little less CPU.
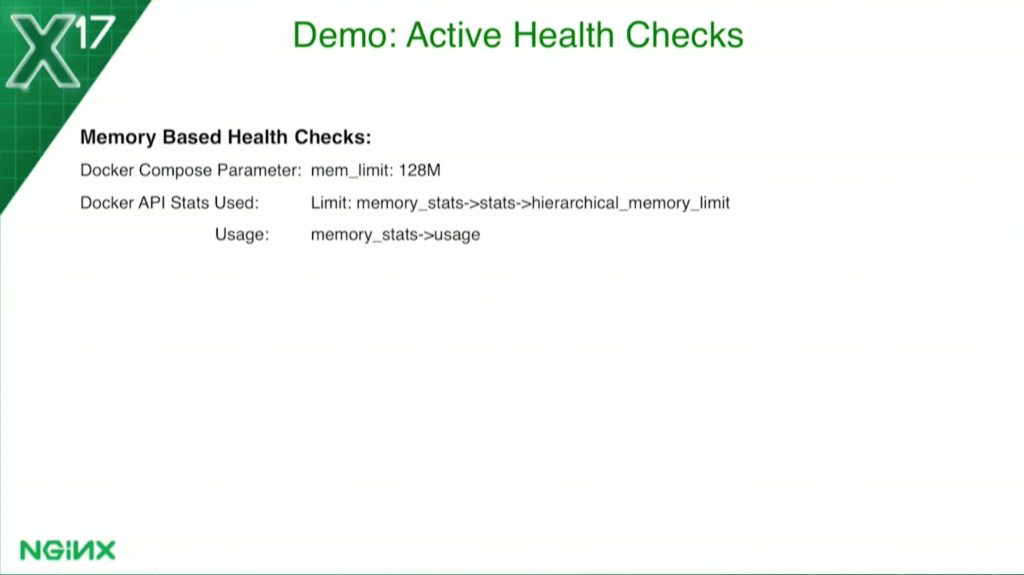
For the memory-based health check, it’s a little bit different. I’m actually limiting it – because Docker makes this easy – to 128 MB. But I get the data, again, from the Docker status API, to tell me how much memory it’s using. Again, I chose 70 percent as my threshold. If the usage goes above 70, it marks it unhealthy; when it goes below 70, it becomes healthy again.
I’m going to briefly go through the configuration here; this will all be in Docker Hub after the conference. I’m not going to read through every line. If you know NGINX, the configuration is fairly straightforward and quite minimal.
I haven’t followed all the best practices. If you ran the configuration through NGINX Amplify, Amplify would object to my configs and say that I’m missing server names, keepalive, and all that kind of stuff. But I’ve intentionally kept it to as few lines as possible and still made it clear.
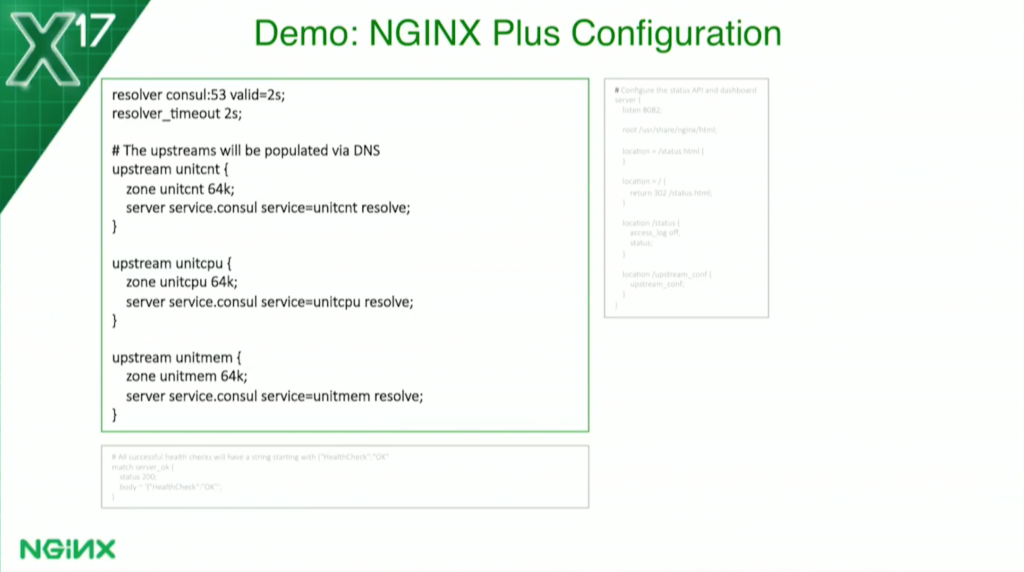
Here’s where I define my upstreams. If you see resolver console, valid 2 seconds, that tells me to use Consul as my DNS and dynamically re-resolve all domain names every two seconds. I’m ignoring the time to live and just saying two seconds. I could make it one as well, but I thought two was good enough for this.
You’ll see in each upstream where I have the server directive with the service parameter, that again ties us into Consul and gives us SRV record support.
I’m using standard Dockers – that’s who’ll map the ports, and that allows us to actually get the ports from DNS, not just the IP addresses.
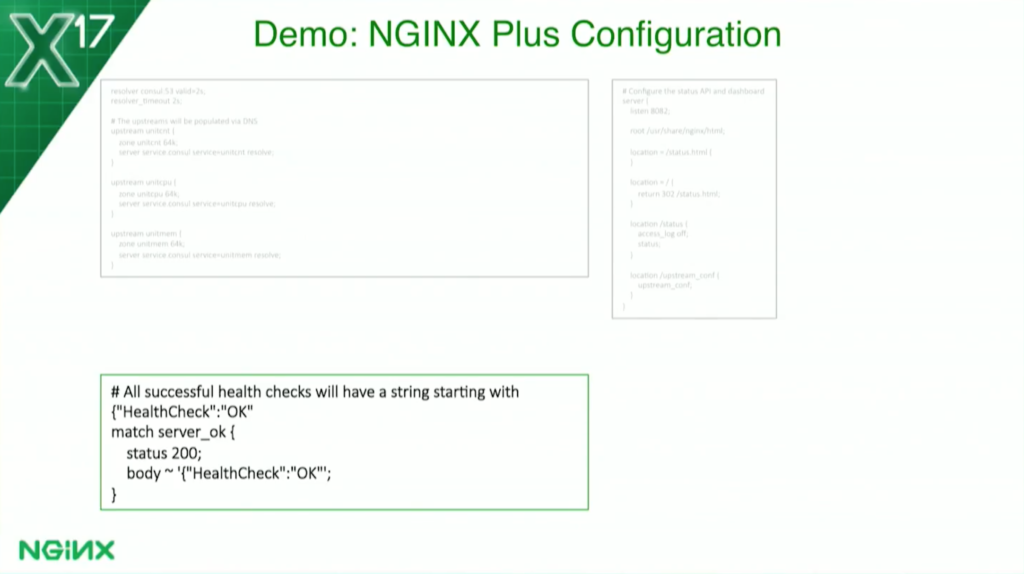
The lower one is a match block. This is for NGINX Plus health checks. This tells the health check what a valid response is. I’ve told it I want it at 200 and I want to see the body starting with “Healthcheck” “OK” because, as I showed you a couple of slides ago, that tells me it’s OK. That’s what I’m going to look for. If it doesn’t see that, it marks it unhealthy.
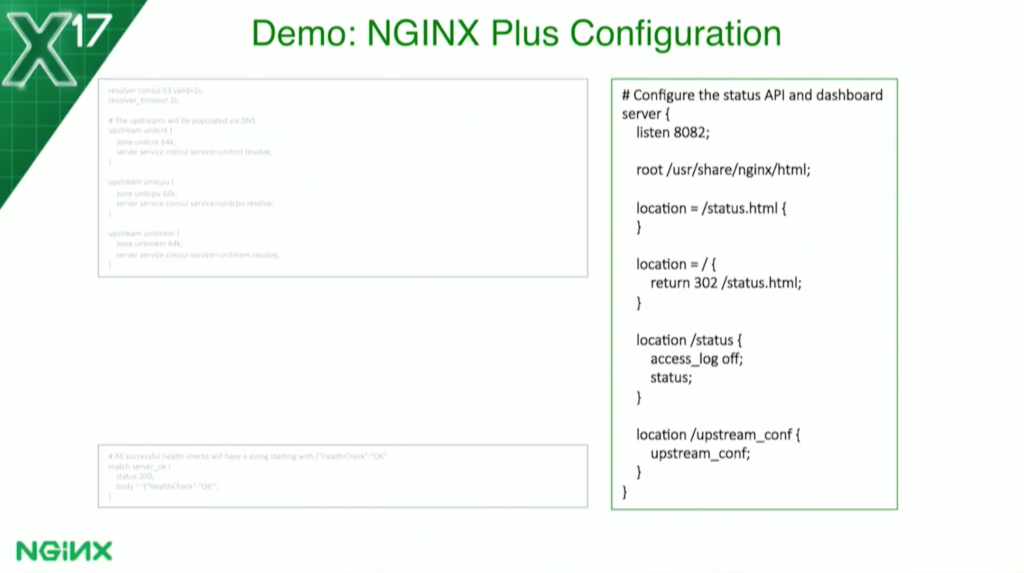
On the right, I’ve defined our status API – which, again, I’m using to get the count of the number of containers. I listen to port 8082, and anything that goes to /status will get me the raw JSON, which is what my program is using. Anything that goes to status.html will get us our actual dashboard page, which some of you may have seen, which I’ll show you in a minute.
On the bottom there – although it’s not used in this demo, I just have it in all my configs – I’ve enabled the upstream configuration API of NGINX Plus again because I’m using DNS for service discovery. But we also have a push method where you can call an API, if you want to do service discovery that way.
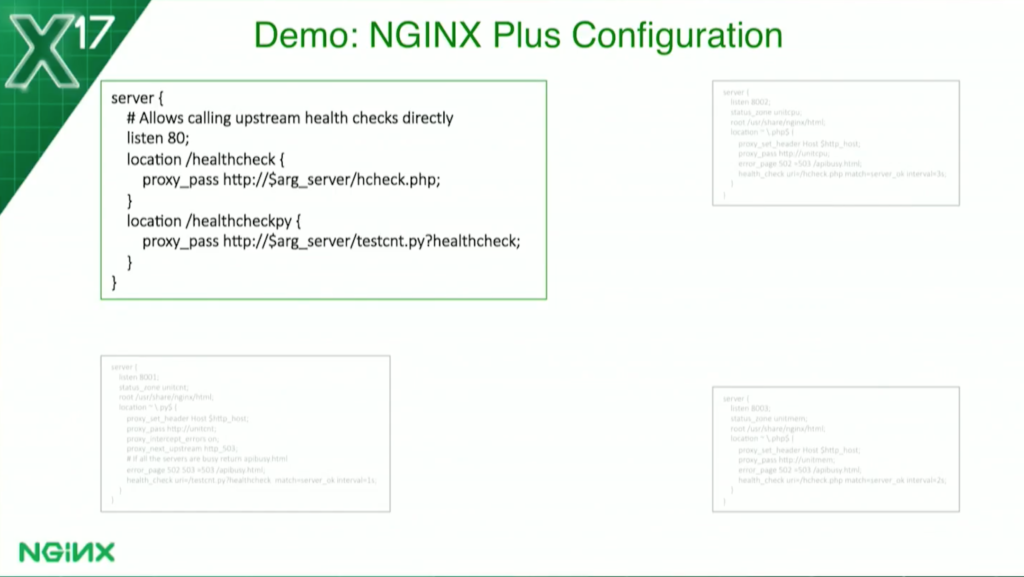
Now, for my server blocks, I’m going to go into detail here. This one in the upper left is a special one I put in just for the demo. I wanted to be able to show you an unsuccessful health check, but it turns out, with regular server blocks, I can never do that, because as soon as it fails and goes unhealthy, NGINX won’t send a request to it anymore because it’s down. So I had this one just going directly to the IP and port so I can use a special URL to do that.
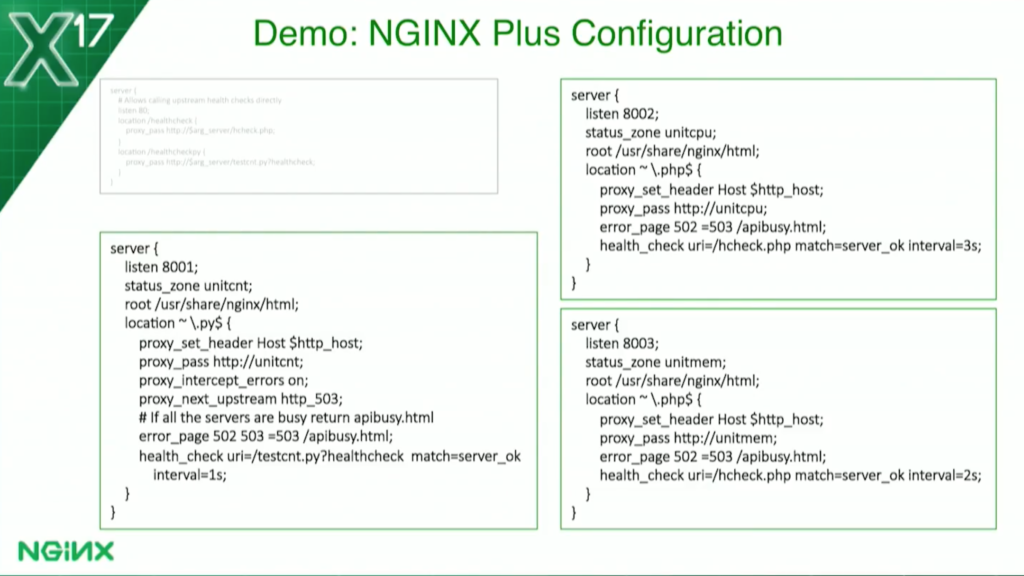
These are the three applications. I’ve got my Python application in the lower left, and my PHP on the right. You’ll notice that they’re all very similar, and the PHP ones are virtually identical except for the upstream groups and the server_status zone names.
I do have the durations a bit different; I have a one-second duration on the server count; the request count one, I really want to get that one quickly. I have two seconds on the memory one, and I added three seconds on the CPU one because that one takes a bit of time since I have to make two requests to the API a second apart, and then do a calculation.
Now, in production, you might lengthen these, to be quite longer than that. But again, for demo, I want things to be very quick.

The Python one’s a little bit different because with Python and Unit, I have one Python program on each listener.
So I’ve actually, in the PHP ones – you can’t see it here, you’ll see it in a minute – I have one program for health checks and one program as the application. Here, I’m using one program where, based on the query parameter, it knows whether to do the health check or whether to run the application.
They’ve also had this: you’ve seen the proxy_next_upstream 503. On the count-based health check, there’s a use case where the request comes, and before a second expires until the health check gets called, NGINX sends another request to it because it thinks it’s healthy.
I’ve programmed the application to say if it gets another request, it’s processed when it returns a 503, and I’ve told NGINX, in that case, to try another server. And all of them, I forgot to mention, have this line here, the error page 502-503.
If all the upstreams are busy and failing health checks, I return a special page, api/busy. It just tells the user there’s nothing available there.

Let’s get on with the demo. I do want to make a disclaimer here: these have not been tested in production, they haven’t been tested at scale, they’re just some ideas I’ve been playing around with. If you want to use something like it, it’ll to take a lot more testing than I put into it.
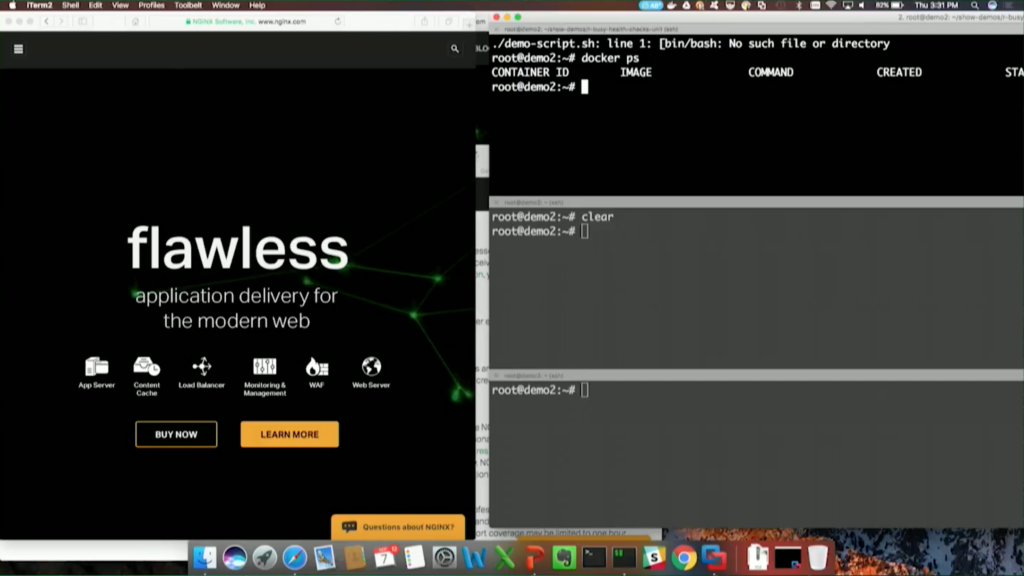
Hopefully, you can see that it’s gray here. First, I’ll make sure I have a clean environment, and I do. I have no Docker containers here. I’m using Docker-Compose for everything, so I’ll spin up some containers.
It’s basically the picture I showed you a moment ago, and we should have a bunch of containers now, and we do.
We should be able to see them in the NGINX Plus status dashboard.
And if we look at our upstreams, we should see three upstreams, each with one server. There’s our count-based, our CPU-based, and our memory-based.
I’m going to scale each up to two, and we can see how the service discovery works with Consul. We’ll see that it’s all automatic. I just hit return here, and we’ll see in a couple of seconds, they’re going to magically appear over there. It’s very quick, and it’s all automatic. I didn’t have to do anything but basically point NGINX at it.
Take a look at the different health checks. If we run a count-based health check – port 8001 is the count-based one – we’ll see it return the JSON I showed you earlier. It said it’s OK. If we run it again, we’ll see it’s getting load-balanced. If you look at the two outputs, you’ll see the host has changed. That tells us that it went to the different ones there.
I want to show you the CPU-based health check first before I go back there. You’ll see that this one takes a while because I’m making an API request, I wait a second, I make an average API request, and I do a calculation. But, you see, it says OK, and you’ll see my CPU utilization is minimal here because nothing’s happening.
I can also show the memory-based health check. This one comes back a bit faster, and it tells me that I’m OK in the memory as well. That’s where I wanted to be.
Now, if we want to make one busy, I have this program that I run: test count, Python. It’s going to create that similar file I talked about. On the left here, we should see one of them go red pretty quickly. By default, this does it, and it waits for 10 seconds. We’ll see, in 10 seconds, that it’s going to come back to life.
I had that special URL so I can see these things directly. We can hit that one – we’re just passing the server name for one of those so we can do the first one there.

There we go. This case is OK, so I can actually hit it either way. I’m going to show that if I make them both busy – we’ll run it again – we should see one go busy, and now, the second one’s going to go busy.
If I try again, we’re going to get that special page I talked about which basically shows that they’re all busy. And I can also run this and see that I get busy. That’s what a failed health check looks like on the count-based health check, because they’re both busy.
Now, I’m going to move on to the CPU-based health checks. For that, I can actually scale it back down to one to show you the difference, and what happens as we scale up and down on this.

Scaling down with Docker-Compose takes a few seconds longer, but we should get it down there in a second. There it goes.
For this, I want to run Docker stats so we can see the CPU utilization on these guys. Right now, I have the threshold set at 70 percent. I only have one container, so that container can use up to 70 percent of the CPU without causing a problem.

If we run this, this should run 50 to 60 percent of the CPU. There, you see at the bottom, it goes to 60 percent and it’s going to be fine. The health check is going to succeed. It’s going to check it again every second, or every three seconds, and realize that it never hit 70 percent.
Now, let’s scale it back up to two again – it always scales up faster than it scales down.

If we run that same program again – I’m going to run it for a little longer this time so it has our stuff – we’re going to see that it’s going to go up again to 60 percent or so, but now it’s going to fail the health check in a second, or it should, anyway. There it goes, and that’s because it’s over the 35 percent, and now it’s available for one.
And we can go ahead and run another one that does less CPU. It’s going to do it on 15 percent or so, 10 percent, and it’s going to run just fine.
We can also see a failed health check by running an 808, changing the URL a bit. This one should come back and say CPU busy, which it does, and that’s why the health check is failing. It’s letting one go through because it’s using too much CPU, and the one that’s using less CPU – it’s blocking one and letting the other go through.

Finally, we have our memory-based health check. For this case, you’ll see the second one from the top that’s limited to 128 MB – that’s how I can identify which one it is. We’re going to see if that memory’s going to shoot up – pretty much almost all there – and that one’s going to go unhealthy as well.

Now – what is that: port 05? We can see, that one’s going to come back and say memory low as it finishes there. But in a few seconds – it’s going to finish now – it should go green.
If we hit that again, we’d see that it’s going to say memory OK.
That’s it for the demo. I hope that was interesting. Again, these are some ideas I’ve been playing around with. If anybody has any questions, please let me know. If not, then have a great day. If anybody wants to come up afterward, I’ll be here.
The post Fun with Health Checks using NGINX Plus and Docker appeared first on NGINX.


Leave a Reply