Leveraging Beacon for NGINX Observability
![]()
table.nginx-blog, table.nginx-blog th, table.nginx-blog td {
border: 2px solid black;
border-collapse: collapse;
}
table.nginx-blog {
width: 100%;
}
table.nginx-blog th {
background-color: #d3d3d3;
align: left;
padding-left: 5px;
padding-right: 5px;
padding-bottom: 2px;
padding-top: 2px;
line-height: 120%;
}
table.nginx-blog td {
padding-left: 5px;
padding-right: 5px;
padding-bottom: 2px;
padding-top: 5px;
line-height: 120%;
}
table.nginx-blog td.center {
text-align: center;
padding-bottom: 2px;
padding-top: 5px;
line-height: 120%;
}
NGINX has been growing in market share ever since its inception and now covers a wide range of solutions including web server, API gateway, load balancer, service mesh, and more. The growth in market share is a true testament to the value proposition NGINX offers to customers.
NGINX is now deployed as an integral component in most business‑critical adaptive applications. With this level of exposure and reliance comes a stronger need for observability to provide visibility and insight into the end-to-end health and performance of the applications.
In a recent survey of NGINX users, we asked “What’s keeping the community up at night?” Security topped the list, followed by reliability and system failure. Continuous measurement and assessment of application health and performance are paramount in alleviating these concerns. Equally important is prompt detection of problems, which we call mean time to know or MTTK. Fast MTTK is vital to ensuring that service outages are resolved quickly for minimum impact on the end‑user experience.
Beacon Provides End-to-End Visibility
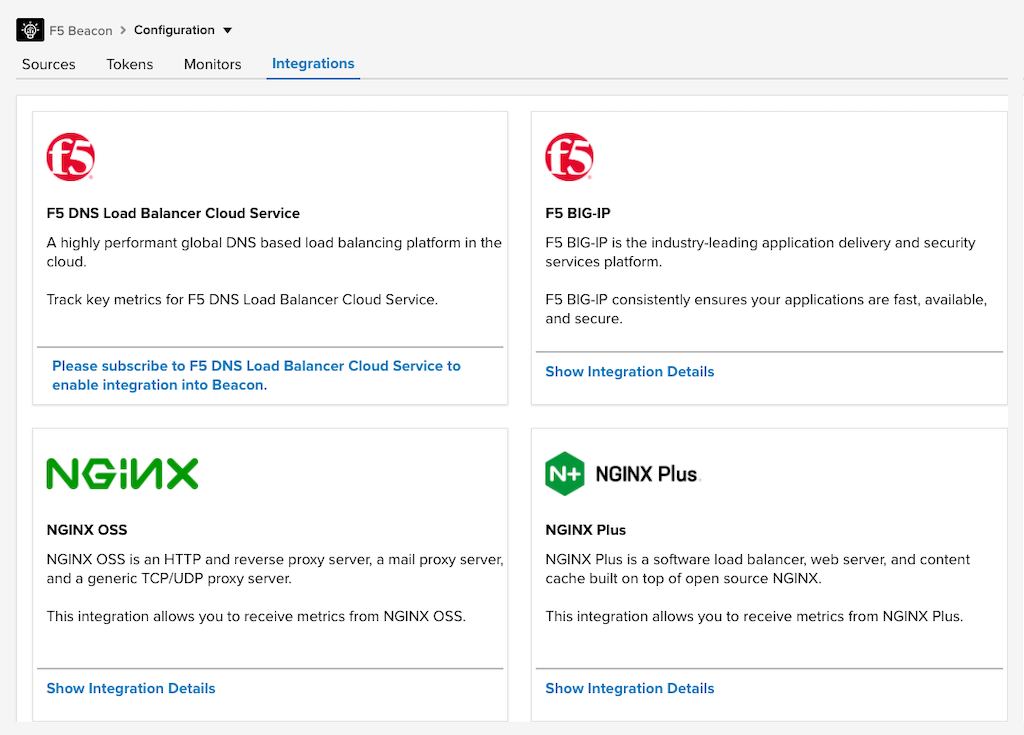
Achieving the right level of observability requires investment both at the organizational and technology level and equally important is a well‑defined strategy to help keep your vision in focus. To help you on your journey to ultimate visibility, we built our SaaS offering, F5 Beacon. With Beacon, you understand the entire application experience from end to end. Beacon ingests telemetry data from diverse sources across the application data plane, including NGINX Open Source and NGINX Plus, and can perform synthetic health checks for added context and visibility.

The Beacon integration with NGINX Open Source and NGINX Plus leverages Telegraf – a widely used open source agent for collecting and transforming metrics. Within a few minutes of applying a simple Telegraf configuration, Beacon starts ingesting metrics from NGINX and you start to gain valuable insights that help improve application performance and end‑user experience.
For instructions on setting up Telegraf and Beacon to collect and display NGINX Open Source metrics, see our documentation. If you’re using NGINX Plus, a larger set of statistics is available; in Step 1 of the Configure Telegraf section in the documentation, substitute [[inputs.nginx_plus_api]] for [[inputs.nginx]].

In a recent Beacon webinar we asked attendees “How long does it typically take to narrow down what caused an issue after it’s been reported?”. Their responses are summarized in the table.
| Time to Diagnosis | % of Respondents |
|---|---|
| Less than 30 minutes | 18% |
| 30 minutes to 2 hours | 46% |
| More than 2 hours | 24% |
| Don’t know | 12% |
Clearly, there’s significant room for improvement. One of Beacon’s biggest strengths is helping you promptly detect app issues and pinpoint which component in the application path is the root cause. The result is reduced MTTK, which enables your teams to focus their efforts on the next steps of the incident‑remediation process.
Beacon is evolving and we are actively working on expanding the platform to cover incident remediation, predictability, and prevention, to give our customers a cohesive observability platform with automation and anomaly detection capabilities. So, stay tuned on this front as we release new features frequently.
Explore Beacon Yourself
Want to try Beacon for yourself? Request a personalized Beacon live demo with one of our product consultants or watch our recent webinar which covers uses cases and demos.
Also check out our Getting Started Guide and try Beacon for yourself with a 45-day free trial.
The post Leveraging Beacon for NGINX Observability appeared first on NGINX.


Leave a Reply