
NGINX Tutorial: How to Use OpenTelemetry Tracing to Understand Your Microservices
ul.no-bullets {
list-style-type: none;
}
This post is one of four tutorials that help you put into practice concepts from Microservices March 2023: Start Delivering Microservices:
- How to Deploy and Configure Microservices
- How to Securely Manage Secrets in Containers
- How to Use GitHub Actions to Automate Microservices Canary Deployments
- How to Use OpenTelemetry Tracing to Understand Your Microservices (this post)
A microservices architecture comes with many benefits, including increased team autonomy and increased flexibility in scaling and deployment. On the downside, the more services in a system (and a microservices app can have dozens or even hundreds), the more difficult it becomes to maintain a clear picture of the overall operation of the system. As writers and maintainers of complex software systems, we know the vital importance of having that clear picture. Observability tooling gives us the power to build that picture across numerous services and supporting infrastructure.
In this tutorial, we highlight one very important type of observability for microservices apps: tracing. Before getting started, let’s define some terms commonly used when discussing observability:
- Observability – The ability to understand the internal state or condition of a complex system (such as a microservices app) based only on knowledge of its external outputs (such as traces, logs, and metrics).
- Monitoring – The ability to observe and check the progress or status of an object over a period of time. For example, you can monitor the traffic coming to your app during peak times, and use that information to scale it appropriately in response.
- Telemetry – The act of gathering metrics, traces, and logs and transferring them from their point of origin to another system for storage and analysis. Also, the data itself.
- Tracing/traces – An account of the journey of a request or an action as it moves through all the nodes of a distributed system.
- Span – A record within a trace of an operation and its associated metadata. Traces are made up of many nested spans.
- Event logging/logs – A time-stamped text record with metadata.
- Metric – A measurement captured at runtime. For example, the amount of memory being used by an application at a certain point in time.
We can use all these concepts to attain insight into the performance of our microservices. Tracing is a particularly useful part of an observability strategy because traces offer a “big picture” of what’s happening across multiple, often loosely coupled, components when a request is made. It is also a particularly effective way to identify performance bottlenecks.
This tutorial uses the tracing tool kit from OpenTelemetry (OTel), an open source vendor-neutral standard for collecting, processing, and exporting telemetry that is rapidly gaining in popularity. In OTel’s conception, a trace slices up a data flow, which may involve multiple services, into a series of chronologically arranged “chunks” that can help you easily understand:
- All the steps that happened in a “chunk”
- How long all these steps took
- Metadata about each step
If you’re unfamiliar with OTel, see What Is OpenTelemetry? for a thorough introduction into the standard and considerations for implementing it.
Tutorial Overview
This tutorial focuses on tracing the operations of a microservices app with OTel. In the four challenges in this tutorial, you learn how to track a request through your system and answer questions about your microservices:
- Set up basic OTel instrumentation
- Set up OTel instrumentation and trace visualization for all services
- Learn to read OTel traces
- Optimize instrumentation based on trace readings
These challenges illustrate our recommended process when setting up tracing for the first time. The steps are:
- Understand the system as well as the particular operation you are instrumenting.
- Decide what you need to know from the running system.
- Instrument the system “naively” – meaning use a default configuration without trying to weed out information you don’t need or gather custom data points – and evaluate whether the instrumentation helps you answer your questions.
- Tweak the information that is reported to allow you to more quickly answer those questions.
Note: Our intention in this tutorial is to illustrate some core concepts about telemetry, not to show the right way to deploy microservices in production. While it uses a real “microservices” architecture, there are some important caveats:
- The tutorial does not use a container orchestration framework such as Kubernetes or Nomad. This is so that you can learn about microservices concepts without getting bogged down in the specifics of a certain framework. The patterns introduced here are portable to a system running one of these frameworks.
- The services are optimized for ease of understanding rather than software engineering rigor. The point is to look at a service’s role in the system and its patterns of communication, not the specifics of the code. For more information, see the README files of the individual services.
Tutorial Architecture and Telemetry Goals
Architecture and User Flow
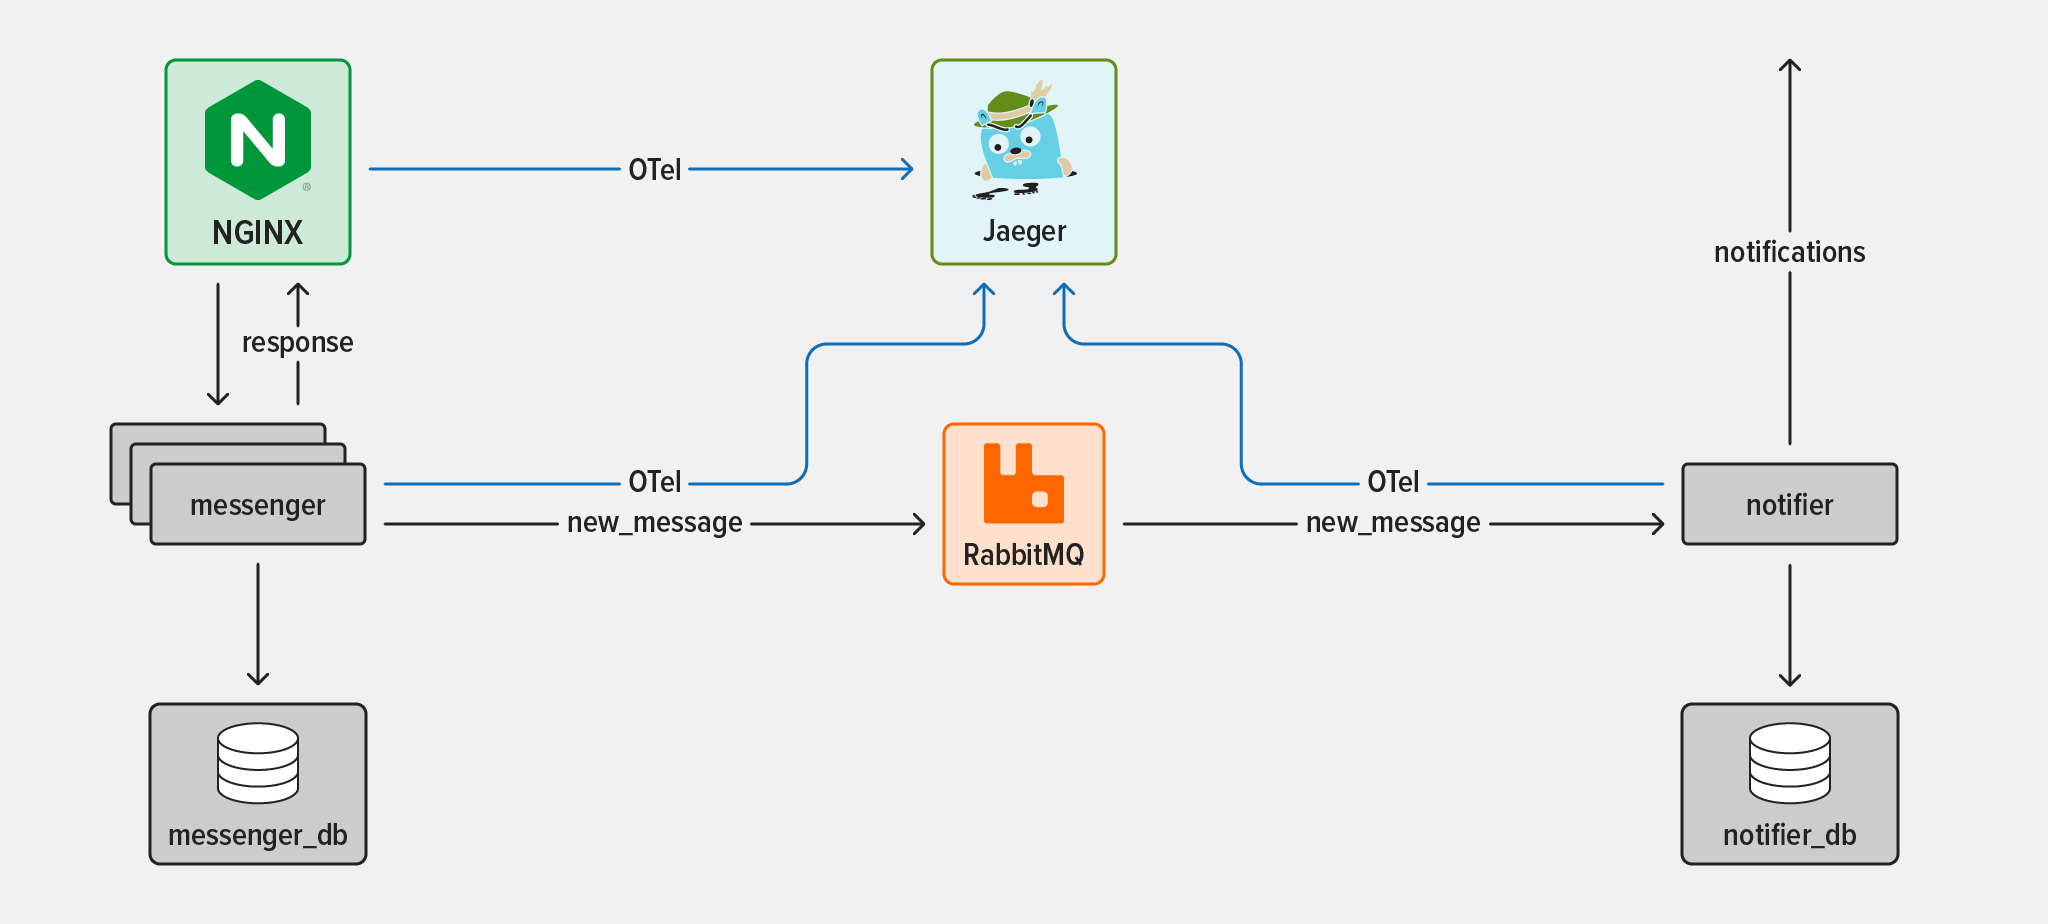
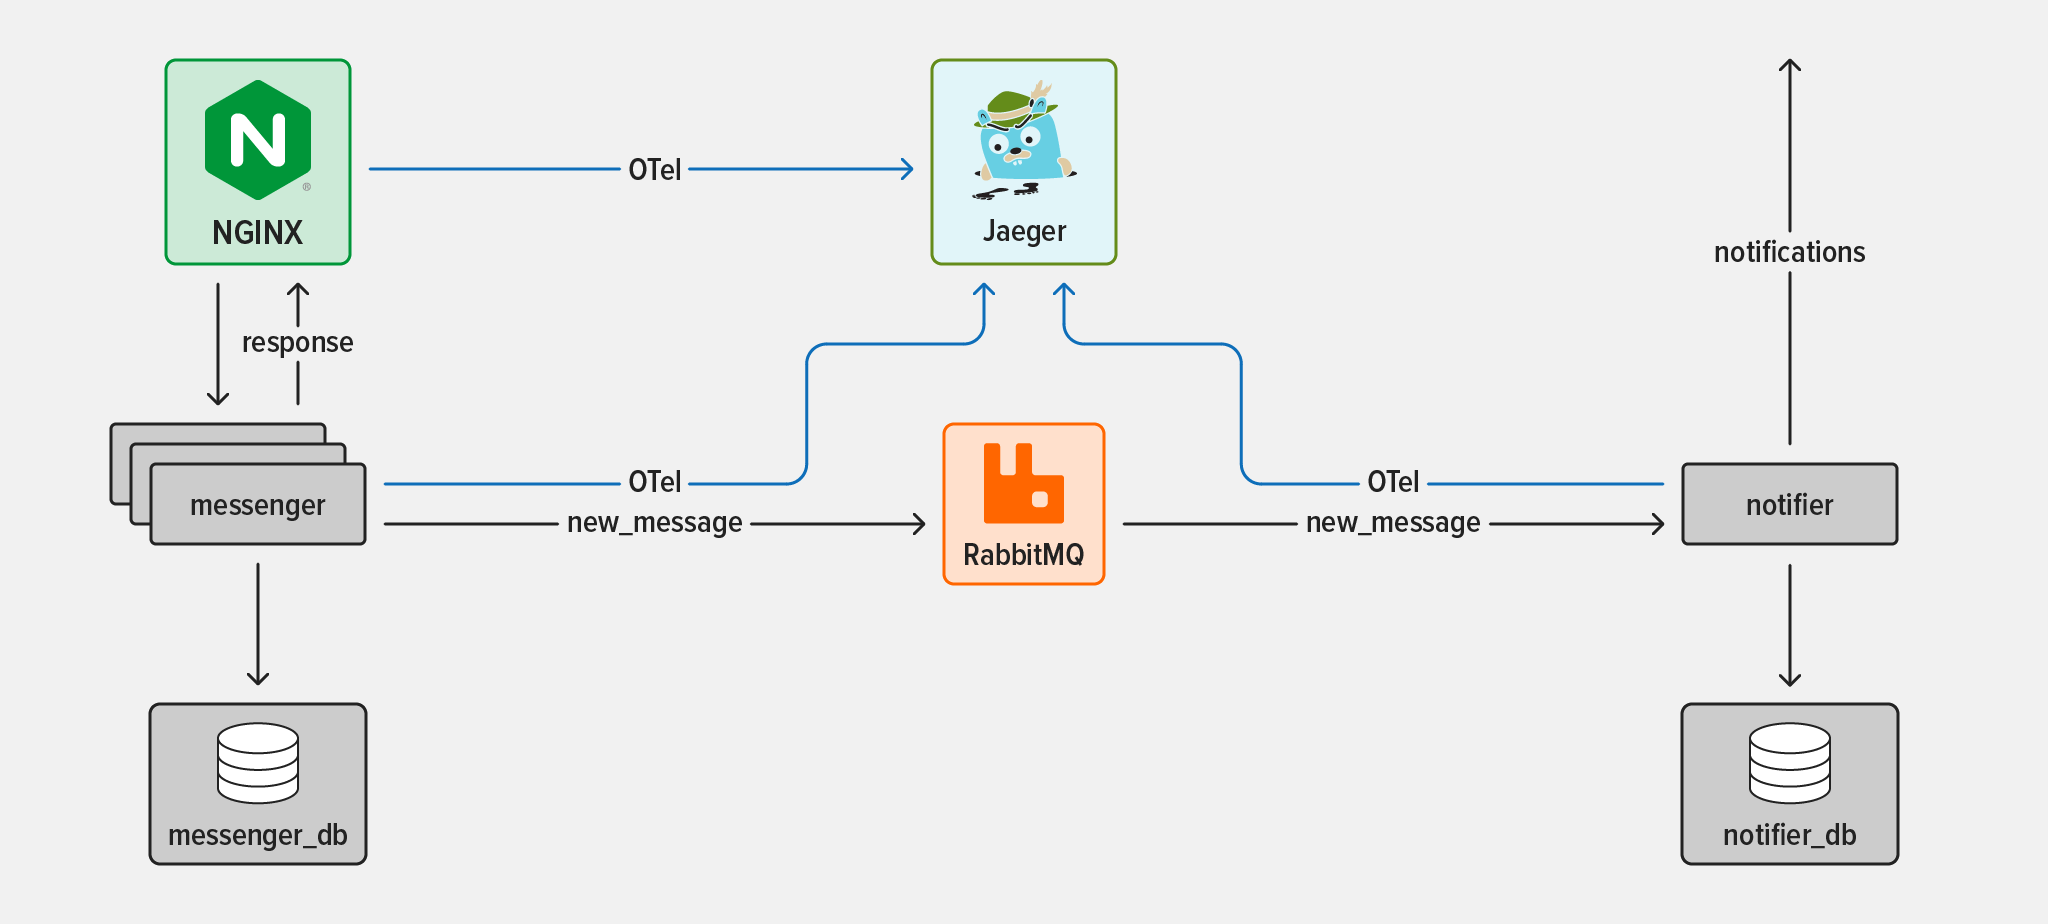
This diagram illustrates the overall architecture and flow of data among the microservices and other elements used in the tutorial.
The two microservices are:
- The messenger service – A simple chat API with message storage capabilities
- The notifier service – A listener that triggers events to alert users, based on their preferences
Three pieces of supporting infrastructure are:
- NGINX Open Source – An entry point to the messenger service and the system at large
- RabbitMQ – A popular open source message broker that enables services to communicate asynchronously
- Jaeger – An open source end-to-end distributed tracing system for collecting and visualizing telemetry from components of the system that produce it
Taking OTel out of the picture for a moment, we can concentrate of the sequence of events that we’re tracing: what happens when a user sends a new chat message and the recipient is notified about it.
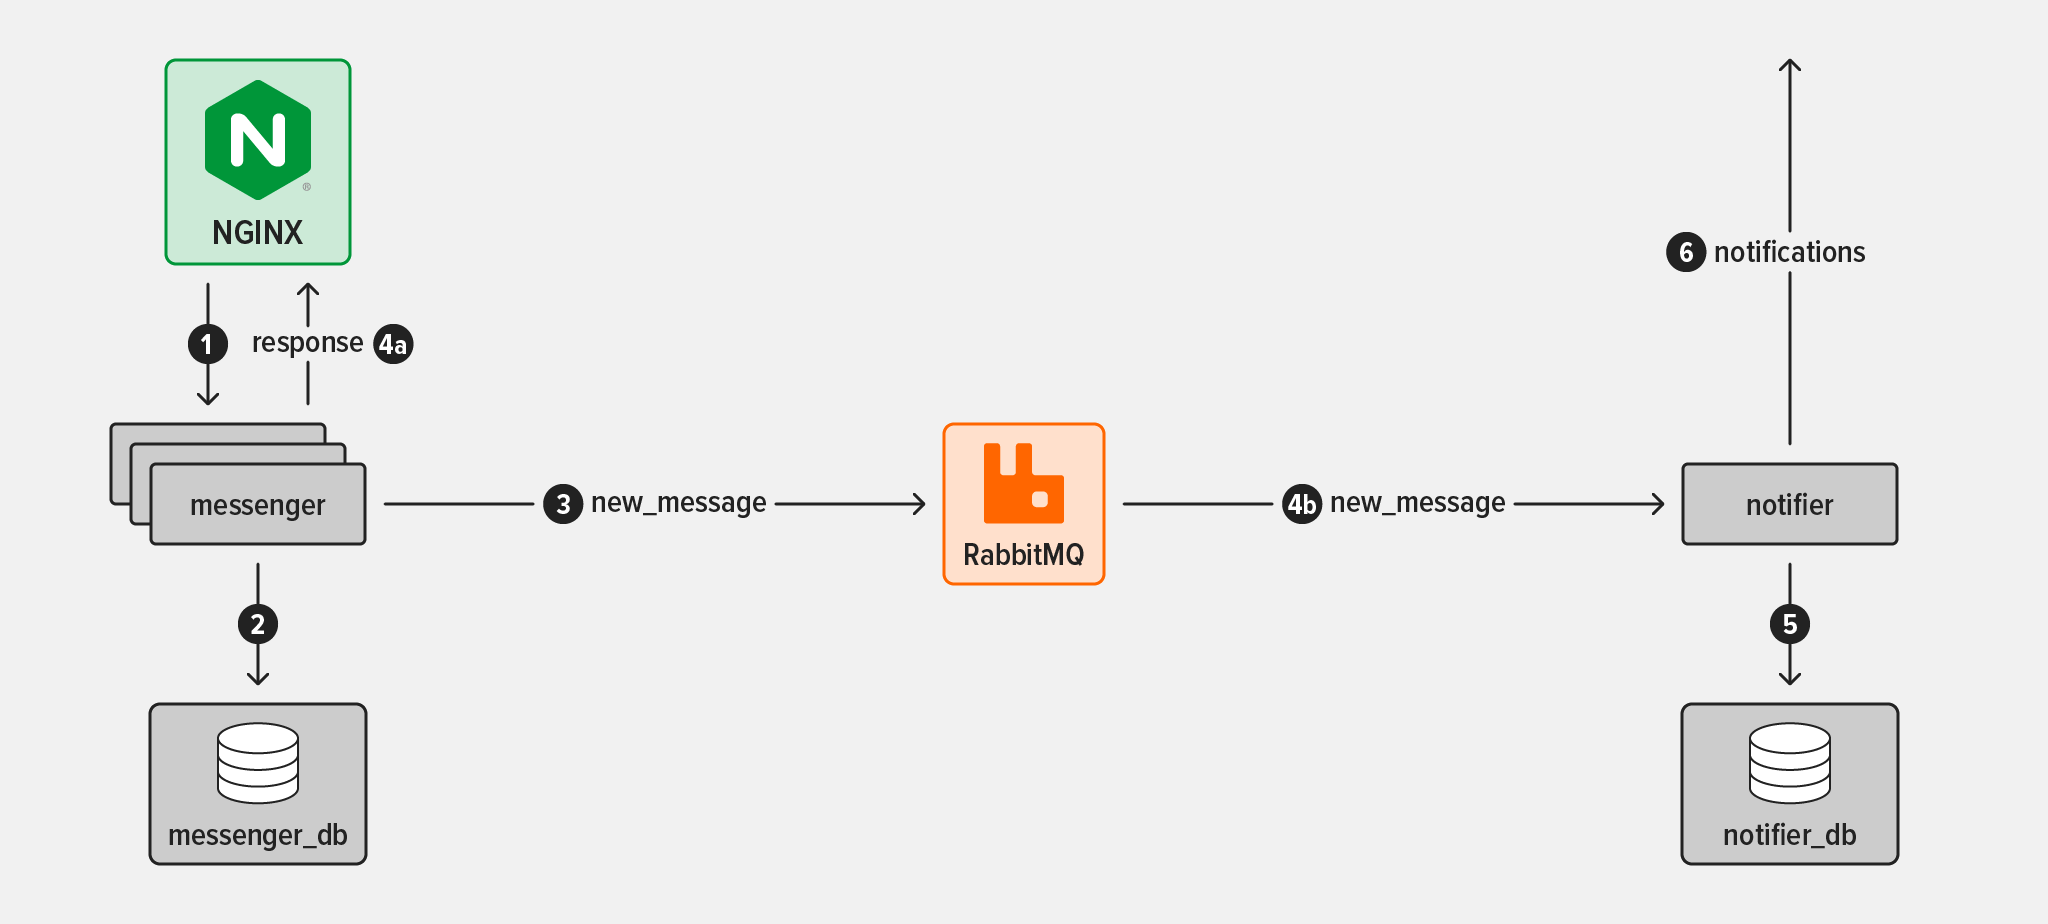
The flow breaks down like this:
- A user sends a message to the messenger service. The NGINX reverse proxy intercepts the message and forwards it to one of many instances of the messenger service.
- The messenger service writes the new message to its database.
- The messenger service produces an event on a RabbitMQ message queue called chat_queue to indicate that a message was sent. The event is generic and has no specific target.
-
At the same time:
- 4a. The messenger service returns a response to the sender reporting that the message was sent successfully.
- 4b. The notifier service notices the new event on the chat_queue and consumes it.
- The notifier service checks its database for the notification preferences of the recipient of the new message.
- The notifier service uses the recipient’s preferred method to send one or many notifications (in this tutorial, the choices of method are SMS and email).
Telemetry Goals
When setting up telemetry instrumentation, it’s best to start with a set of goals for instrumentation more defined than “send everything and hope for insights”. We have three key telemetry goals for this tutorial:
- Understand all the steps a request goes through during the new message flow
- Have confidence that the flow is executing end-to-end within five seconds under normal conditions
- See how long it takes the notifier service to begin processing the event dispatched by the messenger service (excessive delay might mean the notifier service is having trouble reading from the event queue and events are backing up)
Notice that these goals are related to both the technical operation of the system and the user experience.
Tutorial Prerequisites and Set Up
Prerequisites
To complete the tutorial in your own environment, you need:
- A Linux/Unix‑compatible environment
- Basic familiarity with the Linux command line, JavaScript, and
bash(but all code and commands are provided and explained, so you can still succeed with limited knowledge) - Docker and Docker Compose
-
Node.js 19.x or later
curl(already installed on most systems)- The technologies listed in Architecture and User Flow: messenger and notifier (you’ll download them in the next section), NGINX Open Source, Jaeger, and RabbitMQ.
Note: The tutorial uses the JavaScript SDK because the messenger and notifier services are written in Node.js. You also set up the OTel automatic instrumentation feature (also called auto‑instrumentation) so you can get a feel for the type of information available from OTel. The tutorial explains everything you need to know about the OTel Node.js SDK, but for more details, see the OTel documentation.
Set Up
- Start a terminal session.
-
In your home directory, create the microservices-march directory and clone the GitHub repositories for this tutorial into it. (You can also use a different directory name and adapt the instructions accordingly.)
Note: Throughout the tutorial the prompt on the Linux command line is omitted, to make it easier to copy and paste the commands into your terminal. The tilde (
~) represents your home directory.mkdir ~/microservices-march cd ~/microservices-march git clone https://github.com/microservices-march/messenger --branch mm23-metrics-start git clone https://github.com/microservices-march/notifier --branch mm23-metrics-start git clone https://github.com/microservices-march/platform --branch mm23-metrics-start
Challenge 1: Set Up Basic OTel Instrumentation
In this challenge you start the messenger service and configure OTel auto‑instrumentation to send telemetry to the console.
Launch the messenger Service
-
Change to the platform repository and start Docker Compose:
cd ~/microservices-march/platform
docker compose up -d --build
This starts RabbitMQ and Jaeger, which will be used in subsequent challenges.
- The
‑dflag instructs Docker Compose to detach from containers when they have started (otherwise the containers will remain attached to your terminal). - The
--buildflag instructs Docker Compose to rebuild all images on launch. This ensures that the images you are running stay updated through any potential changes to files.
- The
-
Change to the app directory in the messenger repository and install Node.js (you can substitute a different method if you wish):
cd ~/microservices-march/messenger/app asdf install -
Install dependencies:
npm install -
Start the PostgreSQL database for the messenger service:
docker compose up -d -
Create the database schema and tables and insert some seed data:
npm run refresh-db
Configure OTel Auto-Instrumentation Sent to the Console
With OTel auto‑instrumentation, you don’t need to modify anything in the messenger codebase to set up tracing. Instead of being imported into the application code itself, all tracing configuration is defined in a script that is imported into the Node.js process at runtime.
Here you configure auto‑instrumentation of the messenger service with the most basic destination for traces, the console. In Challenge 2, you’ll change the configuration to send traces to Jaeger as an external collector.
-
Still working in the app directory of the messenger repo, install the core OTel Node.js packages:
npm install @opentelemetry/[email protected]
            @opentelemetry/[email protected]
These libraries provide the following functionality:
@opentelemetry/sdk-node– Generation and export of OTel data@opentelemetry/auto-instrumentations-node– Automatic setup with default configuration of all the most common Node.js instrumentations
Note: It is a quirk of OTel that its JavaScript SDKs are broken up into very, very small pieces. So you will be installing a few more packages just for the basic example in this tutorial. To understand which packages you might need to accomplish instrumentation tasks beyond those covered in this tutorial, peruse the (very good) OTel getting started guides and look through the OTel GitHub repository.
-
Create a new file called tracing.mjs to contain the setup and configuration code for OTel tracing:
touch tracing.mjs -
In your preferred text editor, open tracing.mjs and add this code:
//1
import opentelemetry from "@opentelemetry/sdk-node";
import { getNodeAutoInstrumentations } from "@opentelemetry/auto-instrumentations-node";

//2
const sdk = new opentelemetry.NodeSDK({
  traceExporter: new opentelemetry.tracing.ConsoleSpanExporter(),
  instrumentations: [getNodeAutoInstrumentations()],
});

//3
sdk.start();
The code does the following:
- Imports the required functions and objects from the OTel SDK.
-
Creates a new instance of the NodeSDK and configures it to:
- Send spans to the console (
ConsoleSpanExporter). -
Use the auto‑instrumenter as the base set of instrumentation. This instrumentation loads up all the most common auto‑instrumentation libraries. In the tutorial the relevant ones are:
@opentelemetry/instrumentation-pgfor the Postgres database library (pg)@opentelemetry/instrumentation-expressfor the Node.js Express framework@opentelemetry/instrumentation-amqplibfor the RabbitMQ library (amqplib)
- Send spans to the console (
- Starts the SDK.
-
Start the messenger service, importing the auto‑instrumentation script you created in Step 3.
node --import ./tracing.mjs index.mjsAfter a moment, a lot of output related to tracing starts appearing in the console (your terminal):
...
{
  traceId: '9c1801593a9d3b773e5cbd314a8ea89c',
  parentId: undefined,
  traceState: undefined,
  name: 'fs statSync',
  id: '2ddf082c1d609fbe',
  kind: 0,
  timestamp: 1676076410782000,
  duration: 3,
  attributes: {},
  status: { code: 0 },
  events: [],
  links: []
}
...
Note: Leave the terminal session open for reuse in Challenge 2.
Challenge 2: Set Up OTel Instrumentation and Trace Visualization for All Services
There are many tools that you can use to view and analyze traces, but this tutorial uses Jaeger. Jaeger is a simple, open source end-to-end distributed tracing framework with a built-in web-based user interface for viewing spans and other tracing data. The infrastructure provided in the platform repository includes Jaeger (you started it in Step 1 of Challenge 1), so you can focus on analyzing data instead of dealing with complex tooling.
Jaeger is accessible at the http://localhost:16686 endpoint in your browser, but if you access the endpoint right now, there’s nothing to see about your system. That’s because the traces you’re currently collecting are being sent to the console! To view trace data in Jaeger, you need to export the traces using the OpenTelemetry protocol (OTLP) format.
In this challenge you instrument the core user flow by configuring instrumentation for:
- The messenger service, switching the destination for traces from the console to Jaeger
- The notifier service
- NGINX
Configure OTel Auto-Instrumentation Sent to an External Collector
As a reminder, using OTel auto‑instrumentation means you don’t modify anything in the messenger codebase to set up tracing. Instead, all tracing configuration is in a script that is imported into the Node.js process at runtime. Here you change the destination for traces generated by the messenger service from the console to an external collector (Jaeger in this tutorial).
-
Still working in the same terminal as in Challenge 1, and in the app directory of the messenger repo, install the OTLP exporter Node.js package:
npm install @opentelemetry/[email protected]The
@opentelemetry/exporter-trace-otlp-httplibrary exports trace information in OTLP format via HTTP. It’s used when sending telemetry to an OTel external collector. -
Open tracing.mjs (which you created and edited in Challenge 1) and make these changes:
-
Add this line to the set of
importstatements at the top of the file:import { OTLPTraceExporter } from "@opentelemetry/exporter-trace-otlp-http"; -
Change the “exporter” that you provide to the OTel SDK from the console exporter used in Challenge 1 to one that can send OTLP data over HTTP to an OTLP-compatible collector. Replace:
traceExporter:new opentelemetry.tracing.ConsoleSpanExporter(),with:
traceExporter: new OTLPTraceExporter({ headers: {} }),
Note: For simplicity’s sake, the tutorial assumes the collector lives at the default location, http://localhost:4318/v1/traces. In a real system, it’s a good idea to set the location explicitly.
-
-
Press
Ctrl+cto stop the messenger service, which you started in this terminal in Step 4 of Configure OTel Auto-Instrumentation Sent to the Console. Then restart it to use the new exporter configured in Step 2:^c node --import ./tracing.mjs index.mjs -
Start a second, separate terminal session. (Subsequent instructions call this the client terminal and the original terminal – used in Steps 1 and 3 – the messenger terminal.) Wait about ten seconds, then send a health‑check request to the messenger service (you can run this a few times if you want to see multiple traces):
curl -X GET http://localhost:4000/healthWaiting ten seconds before sending the request helps make your trace easier to find, because it comes after the many traces that the auto‑instrumentation generates as the service starts.
-
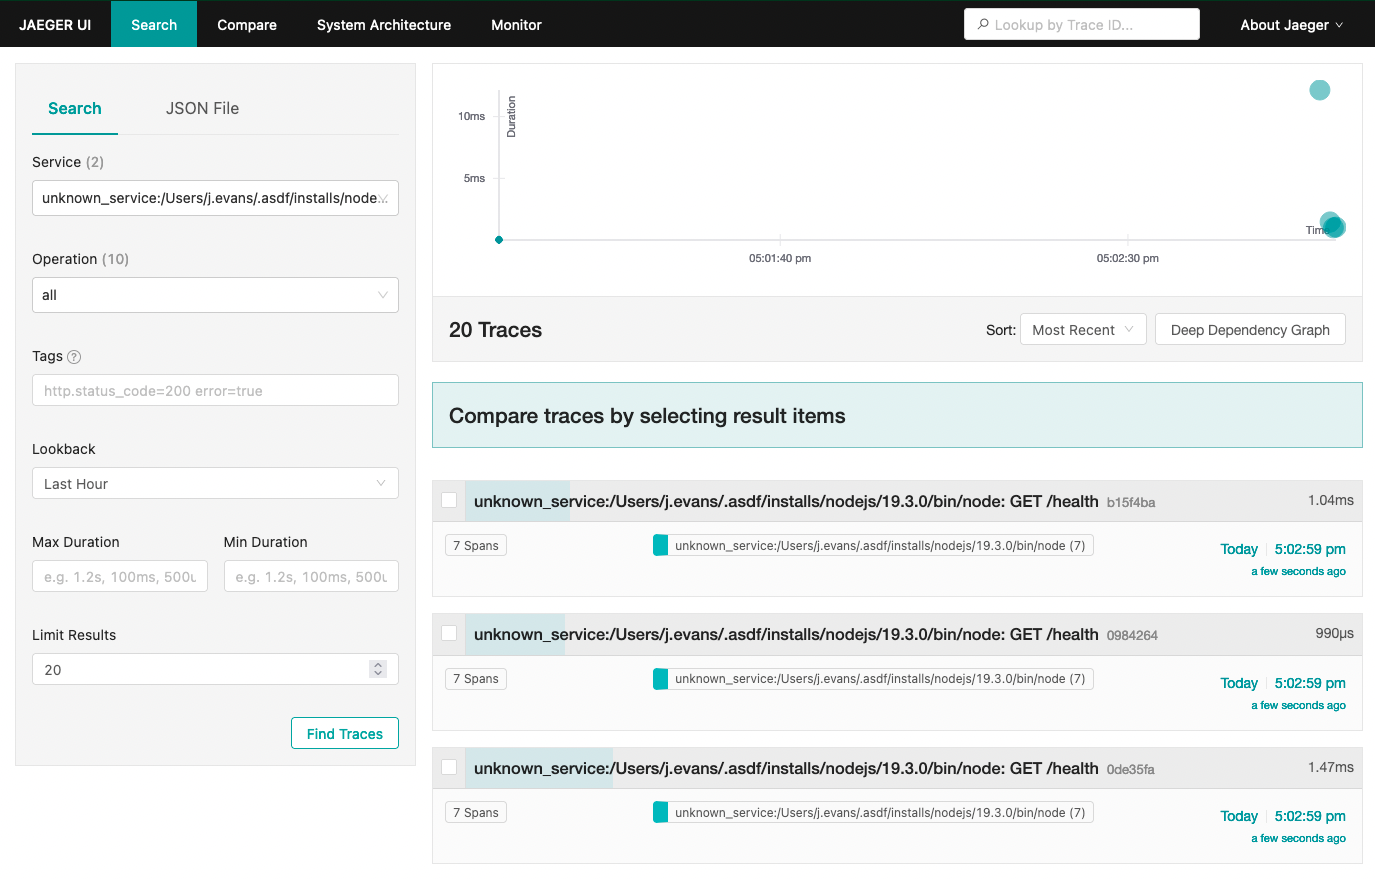
In a browser, access the Jaeger UI at http://localhost:16686 and verify the OTLP exporter is working as expected. Click Search in the title bar and from the drop‑down menu in the Service field select the service whose name starts with unknown_service. Click the Find Traces button:
-
Click a trace in the right side of the window to display a list of the spans in it. Each span describes the operations, sometimes involving multiple services, that ran as part of the trace. The jsonParser span in the screenshot shows how long it took to run the
jsonParserportion of the messenger service’s request‑handling code.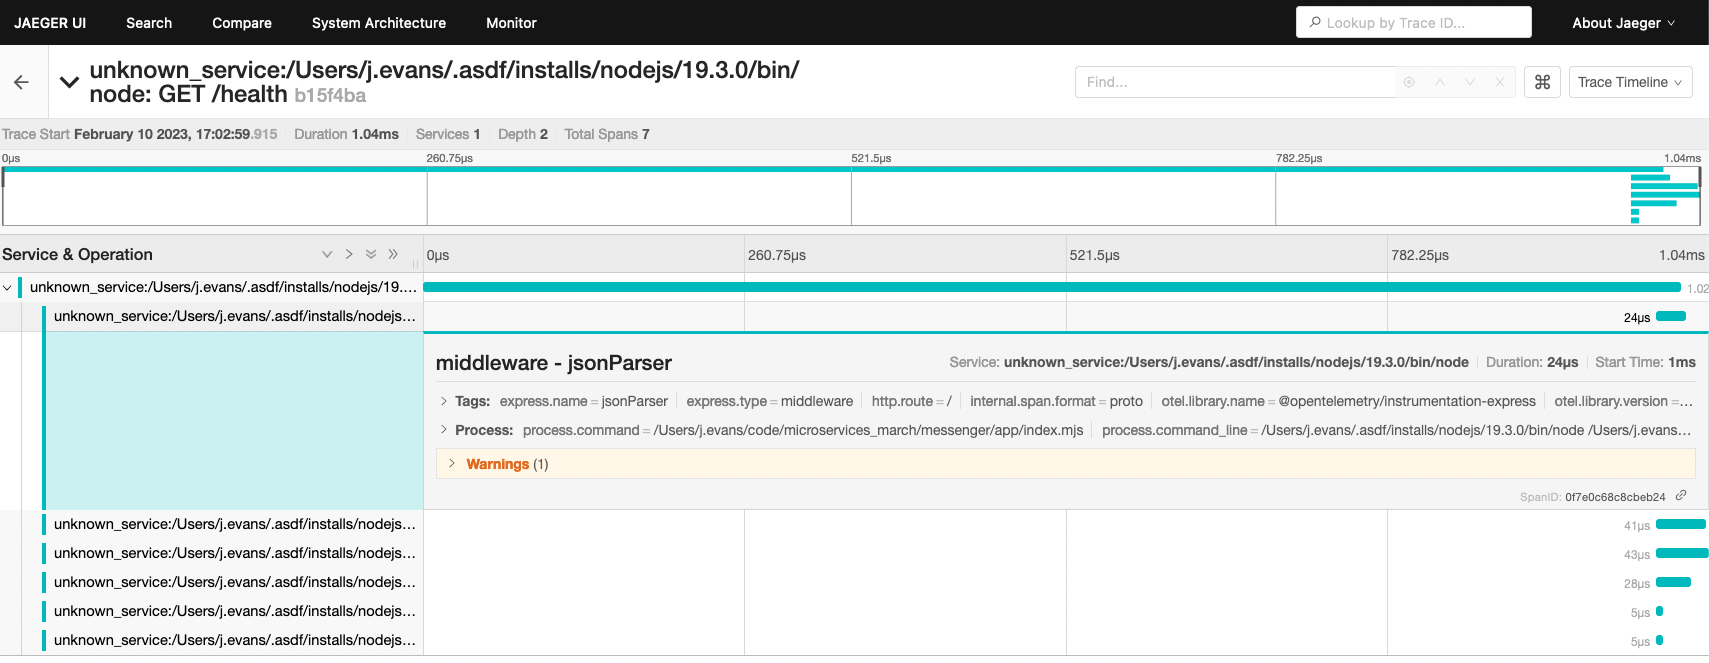
-
As noted in the Step 5, the name of the service as exported by the OTel SDK (unknown_service) is not meaningful. To fix this, in the messenger terminal press
Ctrl+cto stop the messenger service. Then install a couple more Node.js packages:^c npm install @opentelemetry/[email protected] @opentelemetry/[email protected]These two libraries provide the following functionality:
@opentelemetry/semantic-conventions– Defines the standard attributes for traces as defined in the OTel specification.@opentelemetry/resources– Defines an object (resource) that represents the source generating the OTel data (in this tutorial, the messenger service).
-
Open tracing.mjs in a text editor and make these changes:
-
Add these lines to the set of
importstatements at the top of the file:import { Resource } from "@opentelemetry/resources"; import { SemanticResourceAttributes } from "@opentelemetry/semantic-conventions"; -
Create a
resourcecalledmessengerunder the correct key in the OTel spec by adding the following line after the lastimportstatement:const resource = new Resource({ [SemanticResourceAttributes.SERVICE_NAME]: "messenger", }); -
Pass the
resourceobject to the NodeSDK constructor by adding the line highlighted in orange between the lines in black:const sdk = new opentelemetry.NodeSDK({ resource, traceExporter: new OTLPTraceExporter({ headers: {} }), instrumentations: [getNodeAutoInstrumentations()], });
-
-
Restart the messenger service:
node --import ./tracing.mjs index.mjs -
Wait about ten seconds, then in the client terminal (which you opened in Step 4) send another health‑check request to the server (you can run the command a few times if you want to see multiple traces):
curl -X GET http://localhost:4000/healthNote: Leave the client terminal open for reuse in the next section and the messenger terminal open for reuse in Challenge 3.
-
Confirm that a new service called messenger appears in the Jaeger UI in the browser (this may take a few seconds and you may need to refresh the Jaeger UI):

-
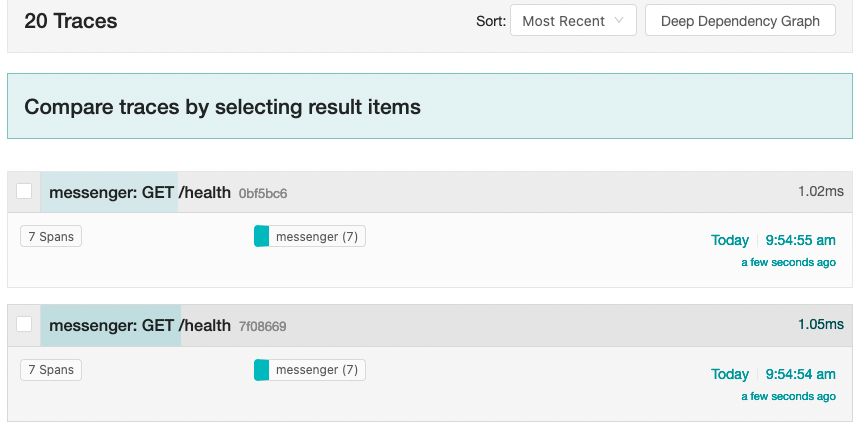
Select messenger from the Service drop‑down menu and click the Find Traces button to see all the recent traces originating from the messenger service (the screenshot shows the 2 most recent of 20):
-
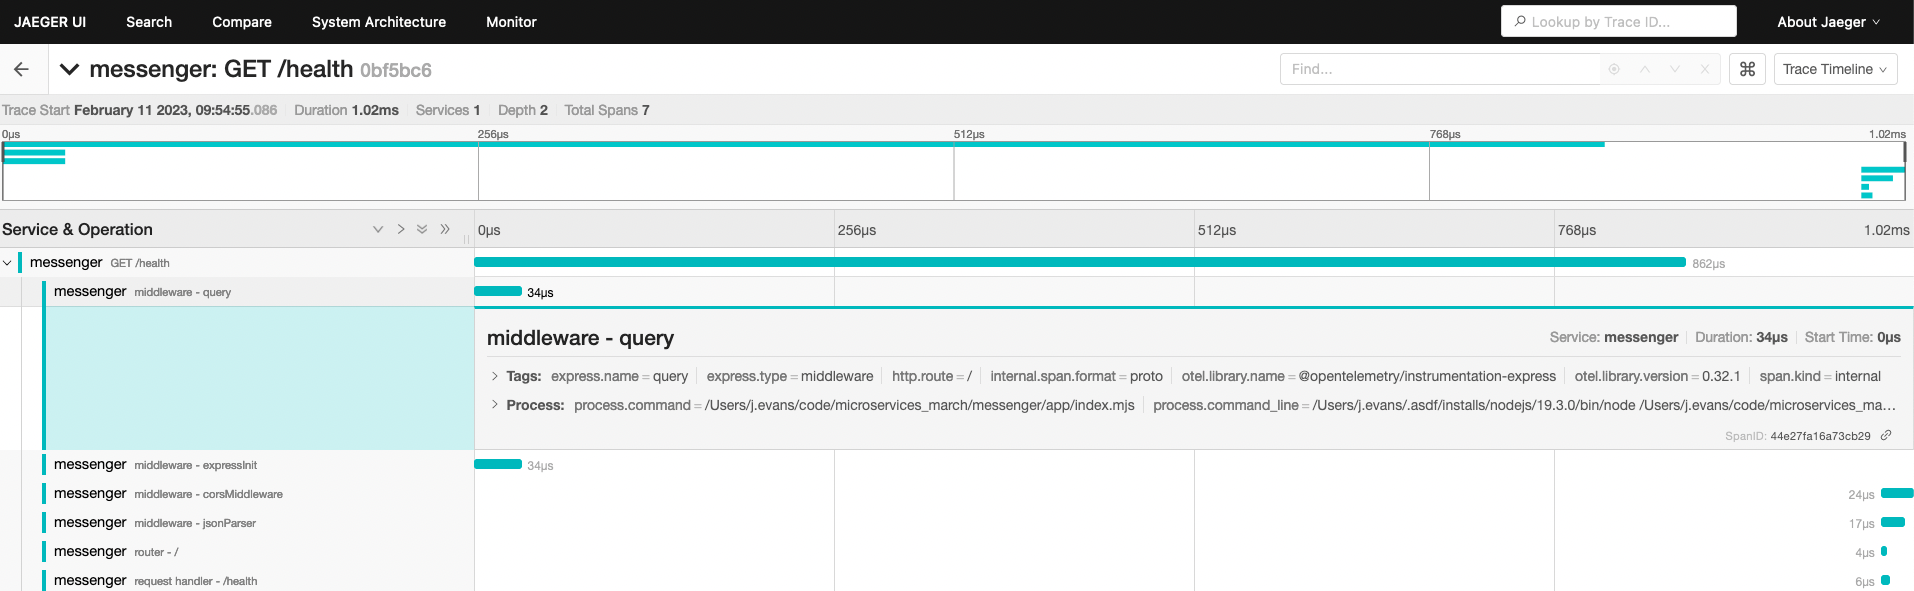
Click on a trace to display the spans in it. Each span is properly tagged as originating from the messenger service:
Configure OTel Auto-Instrumentation of the notifier Service
Now launch and configure auto‑instrumentation for the notifier service, running basically the same commands as in the two previous sections for the messenger service.
-
Open a new terminal session (called the notifier terminal in subsequent steps). Change to the app directory in the notifier repository and install Node.js (you can substitute a different method if you wish):
cd ~/microservices-march/notifier/app asdf install -
Install dependencies:
npm install -
Start the PostgreSQL database for the notifier service:
docker compose up -d -
Create the database schema and tables and insert some seed data:
npm run refresh-db -
Install the OTel Node.js packages (for a description of what the packages do, see Steps 1 and 3 in Configure OTel Auto‑Instrumentation Sent to the Console):
npm install @opentelemetry/[email protected] @opentelemetry/[email protected] @opentelemetry/[email protected] @opentelemetry/[email protected] @opentelemetry/[email protected] -
Create a new file called tracing.mjs:
touch tracing.mjs -
In your preferred text editor, open tracing.mjs and add the following script to get the OTel SDK up and running:
import opentelemetry from "@opentelemetry/sdk-node"; import { getNodeAutoInstrumentations } from "@opentelemetry/auto-instrumentations-node"; import { OTLPTraceExporter } from "@opentelemetry/exporter-trace-otlp-http"; import { Resource } from "@opentelemetry/resources"; import { SemanticResourceAttributes } from "@opentelemetry/semantic-conventions"; const resource = new Resource({ [SemanticResourceAttributes.SERVICE_NAME]: "notifier", }); const sdk = new opentelemetry.NodeSDK({ resource, traceExporter: new OTLPTraceExporter({ headers: {} }), instrumentations: [getNodeAutoInstrumentations()], }); sdk.start();Note: This script is exactly the same as the one for in the messenger service, except that the value in the
SemanticResourceAttributes.SERVICE_NAMEfield isnotifier. -
Start the notifier service with OTel auto‑instrumentation:
node --import ./tracing.mjs index.mjs -
Wait about ten seconds, then in the client terminal send a health‑check request to the notifier service. This service is listening on port 5000 to prevent conflict with the messenger service listening on port 4000:
curl http://localhost:5000/healthNote: Leave the client and notifier terminals open for reuse in Challenge 3.
-
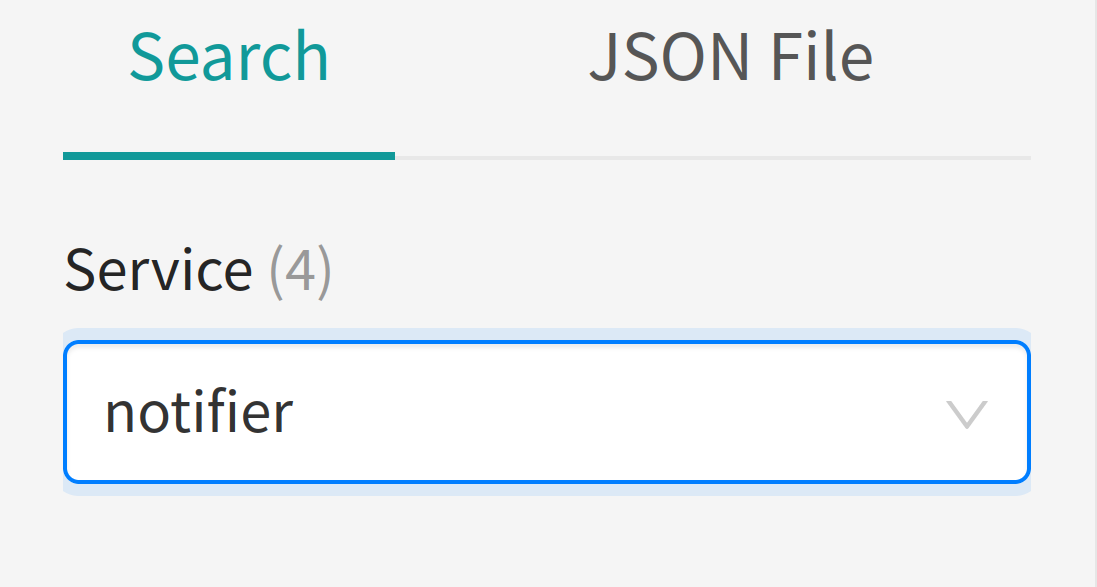
Confirm that a new service called notifier appears in the Jaeger UI in the browser:
Configure OTel Instrumentation of NGINX
For NGINX, you set up tracing manually instead of using the OTel auto‑instrumentation method. Currently, the most common way to instrument NGINX using OTel is to use a module written in C. Third‑party modules are an important part of the NGINX ecosystem, but they require some work to set up. This tutorial does the setup for you. For background information, see Compiling Third‑Party Dynamic Modules for NGINX and NGINX Plus on our blog.
-
Start a new terminal session (the NGINX terminal), change directory to the root of the messenger repository and create a new directory called load-balancer, plus new files called Dockerfile, nginx.conf, and opentelemetry_module.conf:
cd ~/microservices-march/messenger/ mkdir load-balancer cd load-balancer touch Dockerfile touch nginx.conf touch opentelemetry_module.conf -
In your preferred text editor, open Dockerfile add the following (the comments explain what each line does, but you can build and run the Docker container without understanding it all):
FROM --platform=amd64 nginx:1.23.1 # Replace the nginx.conf file with our own COPY nginx.conf /etc/nginx/nginx.conf # Define the version of the NGINX OTel module ARG OPENTELEMETRY_CPP_VERSION=1.0.3 # Define the search path for shared libraries used when compiling and running NGINX ENV LD_LIBRARY_PATH=$LD_LIBRARY_PATH:/opt/opentelemetry-webserver-sdk/sdk_lib/lib # 1. Download the latest version of Consul template and the OTel C++ web server module, otel-webserver-module ADD https://github.com/open-telemetry/opentelemetry-cpp-contrib/releases/download/webserver%2Fv${OPENTELEMETRY_CPP_VERSION}/opentelemetry-webserver-sdk-x64-linux.tgz /tmp RUN apt-get update && apt-get install -y --no-install-recommends dumb-init unzip # 2. Extract the module files && tar xvfz /tmp/opentelemetry-webserver-sdk-x64-linux.tgz -C /opt && rm -rf /tmp/opentelemetry-webserver-sdk-x64-linux.tgz # 3. Install and add the 'load_module' directive at the top of the main NGINX configuration file && /opt/opentelemetry-webserver-sdk/install.sh && echo "load_module /opt/opentelemetry-webserver-sdk/WebServerModule/Nginx/1.23.1/ngx_http_opentelemetry_module.so;n$(cat /etc/nginx/nginx.conf)" > /etc/nginx/nginx.conf # 4. Copy in the configuration file for the NGINX OTel module COPY opentelemetry_module.conf /etc/nginx/conf.d/opentelemetry_module.conf EXPOSE 8085 STOPSIGNAL SIGQUIT -
Open nginx.conf and add the following:
events {} http { include /etc/nginx/conf.d/opentelemetry_module.conf; upstream messenger { server localhost:4000; } server { listen 8085; location / { proxy_pass http://messenger; } } }This extremely basic NGINX configuration file tells NGINX to:
- Set up an upstream group called messenger that represents the group of messenger service instances
- Listen for HTTP requests on port 8085
- Forward all incoming requests for paths starting with / (that is, all incoming requests) to the messenger upstream
Note: This is pretty close to the actual configuration of NGINX as a reverse proxy and load balancer in a production environment. The only major difference is that the argument to the
serverdirective in theupstreamblock is usually a domain name or IP address rather thanlocalhost. -
Open opentelemetry_module.conf and add the following:
NginxModuleEnabled ON; NginxModuleOtelSpanExporter otlp; NginxModuleOtelExporterEndpoint localhost:4317; NginxModuleServiceName messenger-lb; NginxModuleServiceNamespace MicroservicesMarchDemoArchitecture; NginxModuleServiceInstanceId DemoInstanceId; NginxModuleResolveBackends ON; NginxModuleTraceAsError ON; -
Build a Docker image containing NGINX as well as the NGINX OTel module:
docker build -t messenger-lb . -
Start the Docker container for the NGINX reverse proxy and load balancer:
docker run --rm --name messenger-lb -p 8085:8085 --network="host" messenger-lb -
In the client terminal, send a health‑check request to the messenger service through the NGINX reverse proxy and load balancer (there is no need to wait before sending this request):
curl http://localhost:8085/healthNote: Leave the NGINX and client terminals open for reuse in Challenge 3.
-
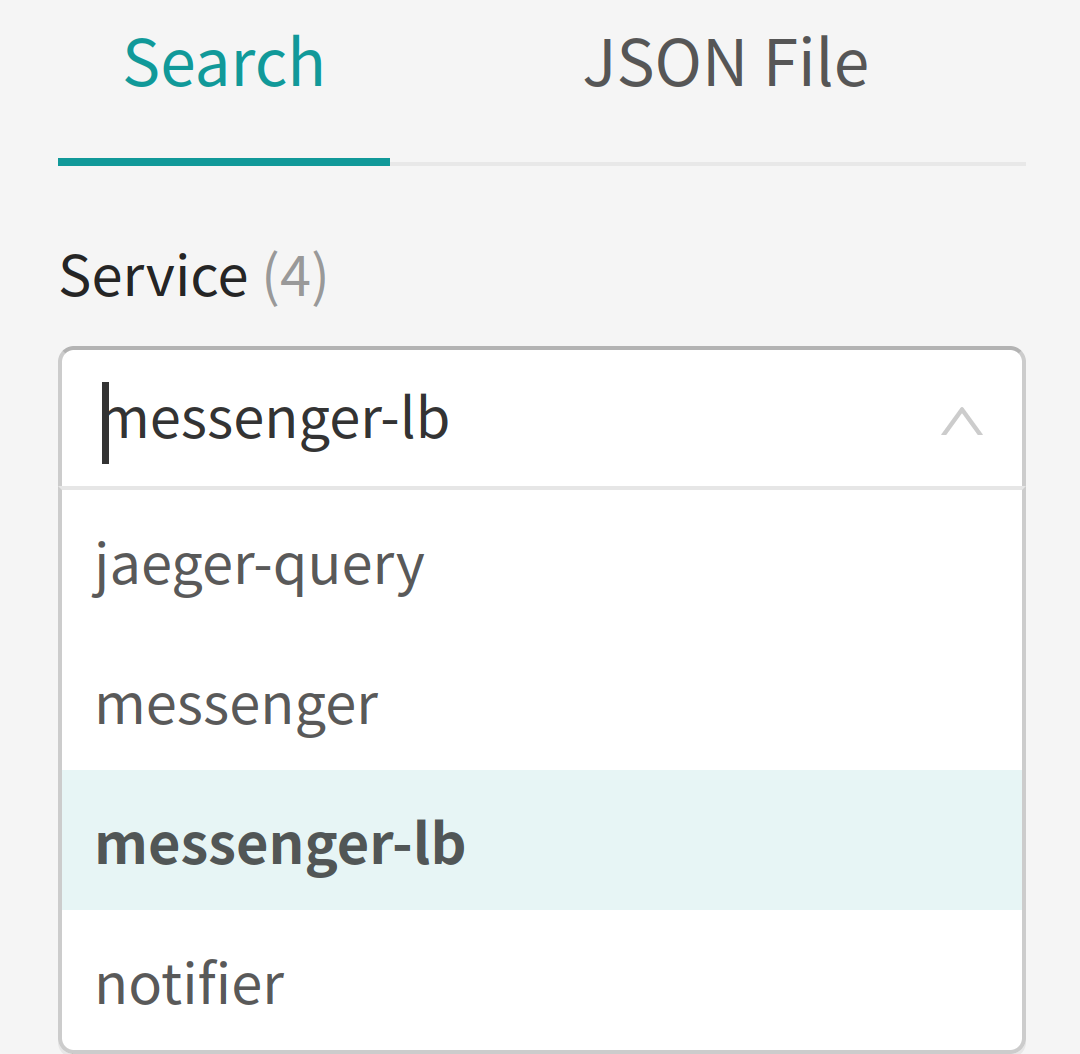
In the browser, confirm the new messenger-lb service is listed in the Jaeger UI along with the services you previously started. You might need to reload the Jaeger UI in your browser.
Challenge 3: Learn to Read OTel Traces
In Architecture and User Flow, we outlined the stages of the user flow, but to recap:
- A user starts a conversation by sending a message to another user.
- The NGINX reverse proxy intercepts the message and forwards it to the messenger service.
- The messenger service writes the message to its database, then dispatches an event through RabbitMQ.
- The notifier service consumes that event, looks up the notification preferences of the recipient (second user), and sends a notification to the recipient via the preferred method.
And the goals of implementing telemetry are:
- Understand all the steps a request undergoes to accomplish the new message flow.
- Have confidence that the flow is executing end-to-end within five seconds under normal conditions.
- See how long it takes the notifier service to begin processing the event dispatched by the messenger service.
In this challenge, you learn how to evaluate whether the traces generated by the OTel instrumentation satisfy the aforementioned goals. First, you take the system for a spin and create some traces. You then inspect the trace for a message flow and the sections of it generated by NGINX, the messenger service, and the notifier service.
Create Trace Data
In the client terminal, set up a conversation and send a couple messages between two users:
curl -X POST
-H "Content-Type: application/json"
-d '{"participant_ids": [1, 2]}'
'http://localhost:8085/conversations'
curl -X POST
-H "User-Id: 1"
-H "Content-Type: application/json"
-d '{"content": "This is the first message"}'
'http://localhost:8085/conversations/1/messages'
curl -X POST
-H "User-Id: 2"
-H "Content-Type: application/json"
-d '{"content": "This is the second message"}'
'http://localhost:8085/conversations/1/messages'Output like the following is generated by the notifier service and appears in the notifier terminal:
Received new_message: {"type":"new_message","channel_id":1,"user_id":1,"index":1,"participant_ids":[1,2]}
Sending notification of new message via sms to 12027621401
Received new_message: {"type":"new_message","channel_id":1,"user_id":2,"index":2,"participant_ids":[1,2]}
Sending notification of new message via email to [email protected]
Sending notification of new message via sms to 19147379938Get Ready to Read the Traces
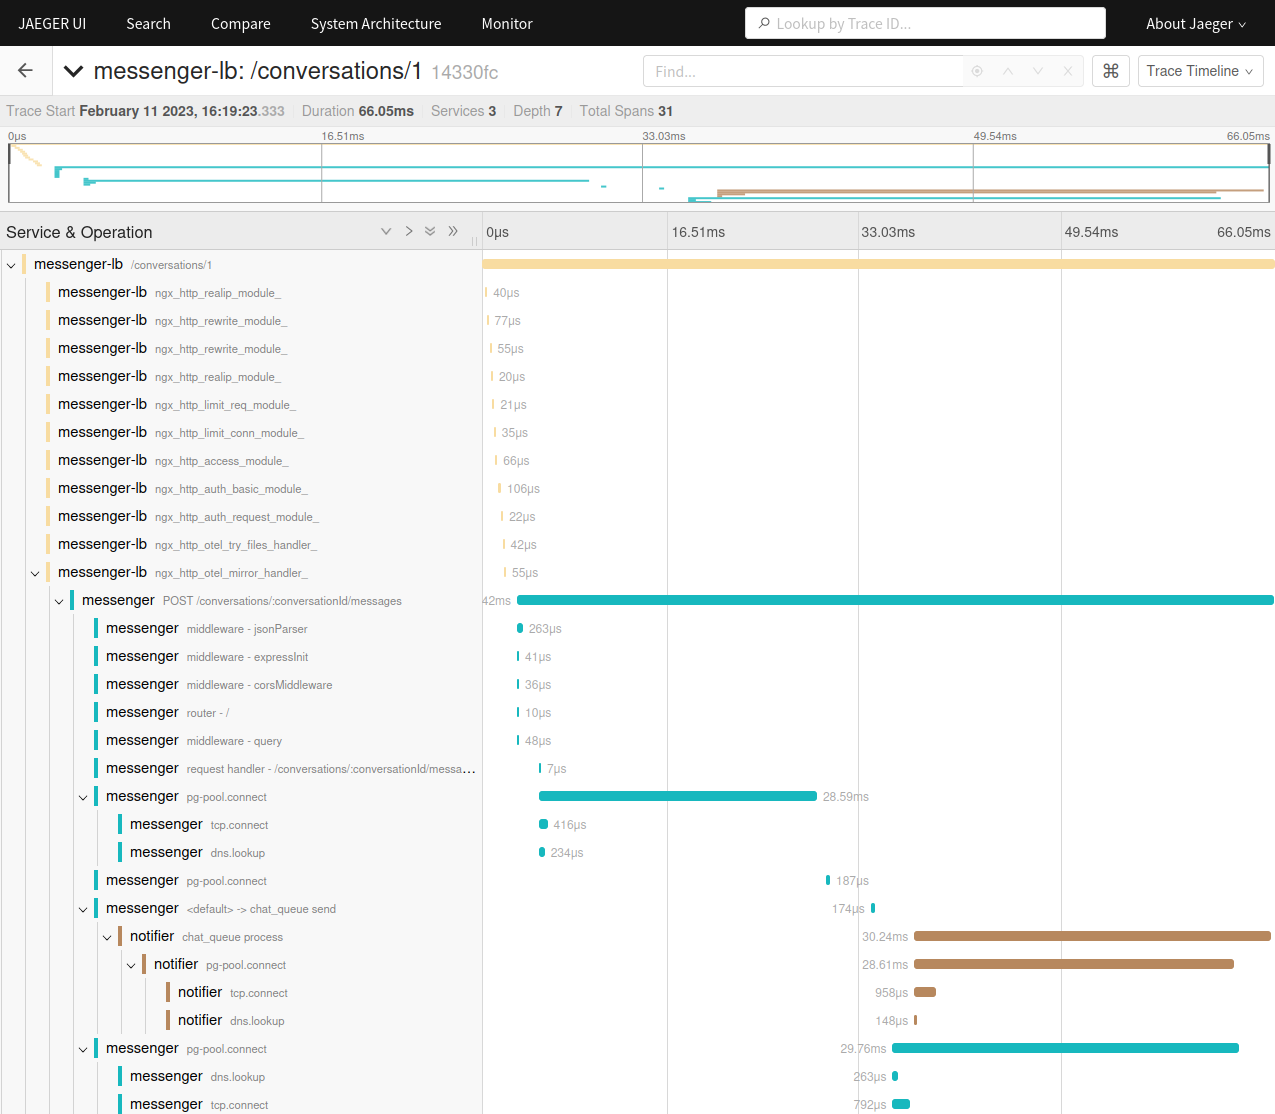
Open the Jaeger UI in the browser, select messenger-lb from the Service drop‑down menu, and click the Find Traces button. A list of traces appears, starting at the very beginning of the flow. Click any trace to display details about it, as in this screenshot:
Click around and explore a bit. Then before moving on, consider how the information in the traces supports your goals for instrumentation as listed in the introduction to Challenge 3. Pertinent questions include:
- What information helps meet the goals?
- What information is missing?
- What information is not relevant?
Examine the NGINX (messenger-lb) Section of the Trace
Goal 1: See All the Steps a Request Undergoes in the New Message Flow
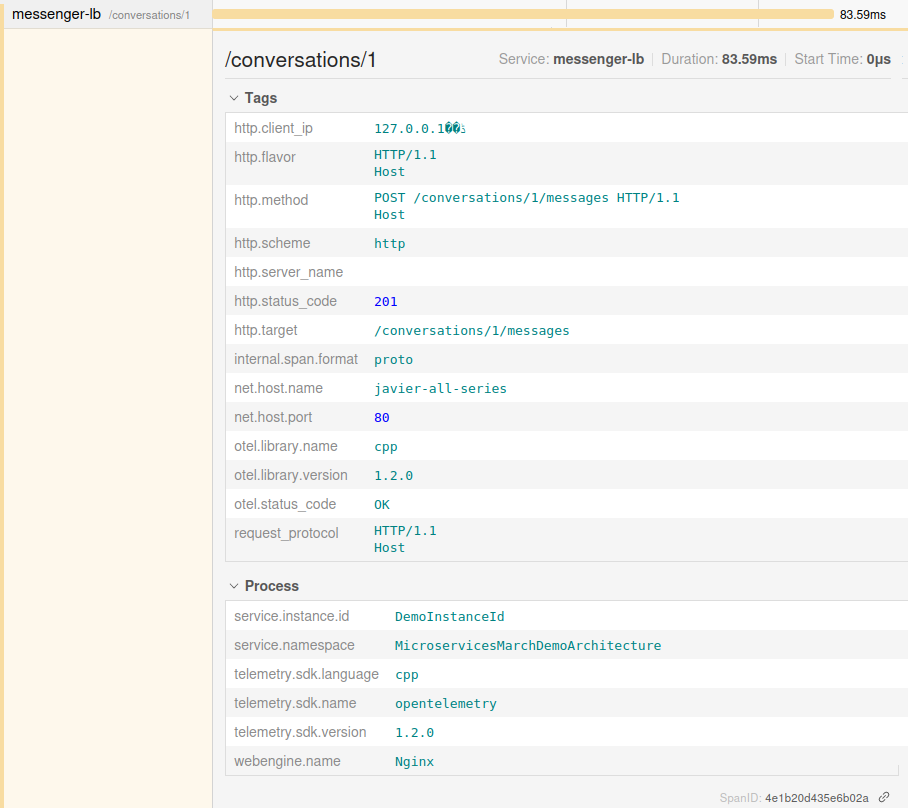
Start with the NGINX span, which has 11 child spans within the parent span. Since the current NGINX configuration is very simple, the child spans are not very interesting and simply show the time taken for each step in the NGINX request‑processing lifecycle. However, the parent span (the very first one) contains some interesting insights:
-
Under Tags you see the following attributes:
http.methodfield –POST(in REST terms this means creation)http.status_codefield –201(indicating successful creation)http.targetfield –conversations/1/messages(the message endpoint)
Taken together, these three pieces of information combine to say: “A
POSTrequest was sent to/conversations/1/messagesand the response was201(created successfully)”. This corresponds to Steps 1 and 4a in Architecture and User Flow). - Under Process, the
webengine.namefield shows that this is the NGINX portion of the request.
Additionally, because the spans for messenger and notifier are nested within the messenger-lb conversations/1 span (as shown in the screenshot in Get Ready to Read the Traces), you can tell that the request sent to the messenger service via the NGINX reverse proxy hit all the expected components in the flow.
This information satisfies the goal because you can see that the NGINX reverse proxy was part of the flow.
Goal 2: Verify that the Flow Executes Within Five Seconds
In the list of spans labeled messenger-lb, look at the most recent span (it’s at the bottom of the list), to see how long the NGINX portion of the request took. In the screenshot, the span started at 589 microseconds (µs) and lasted 24µs, meaning the complete reverse proxy operation took only 613µs – about 0.6 milliseconds (ms). (The exact values will of course be different when you run the tutorial yourself.)
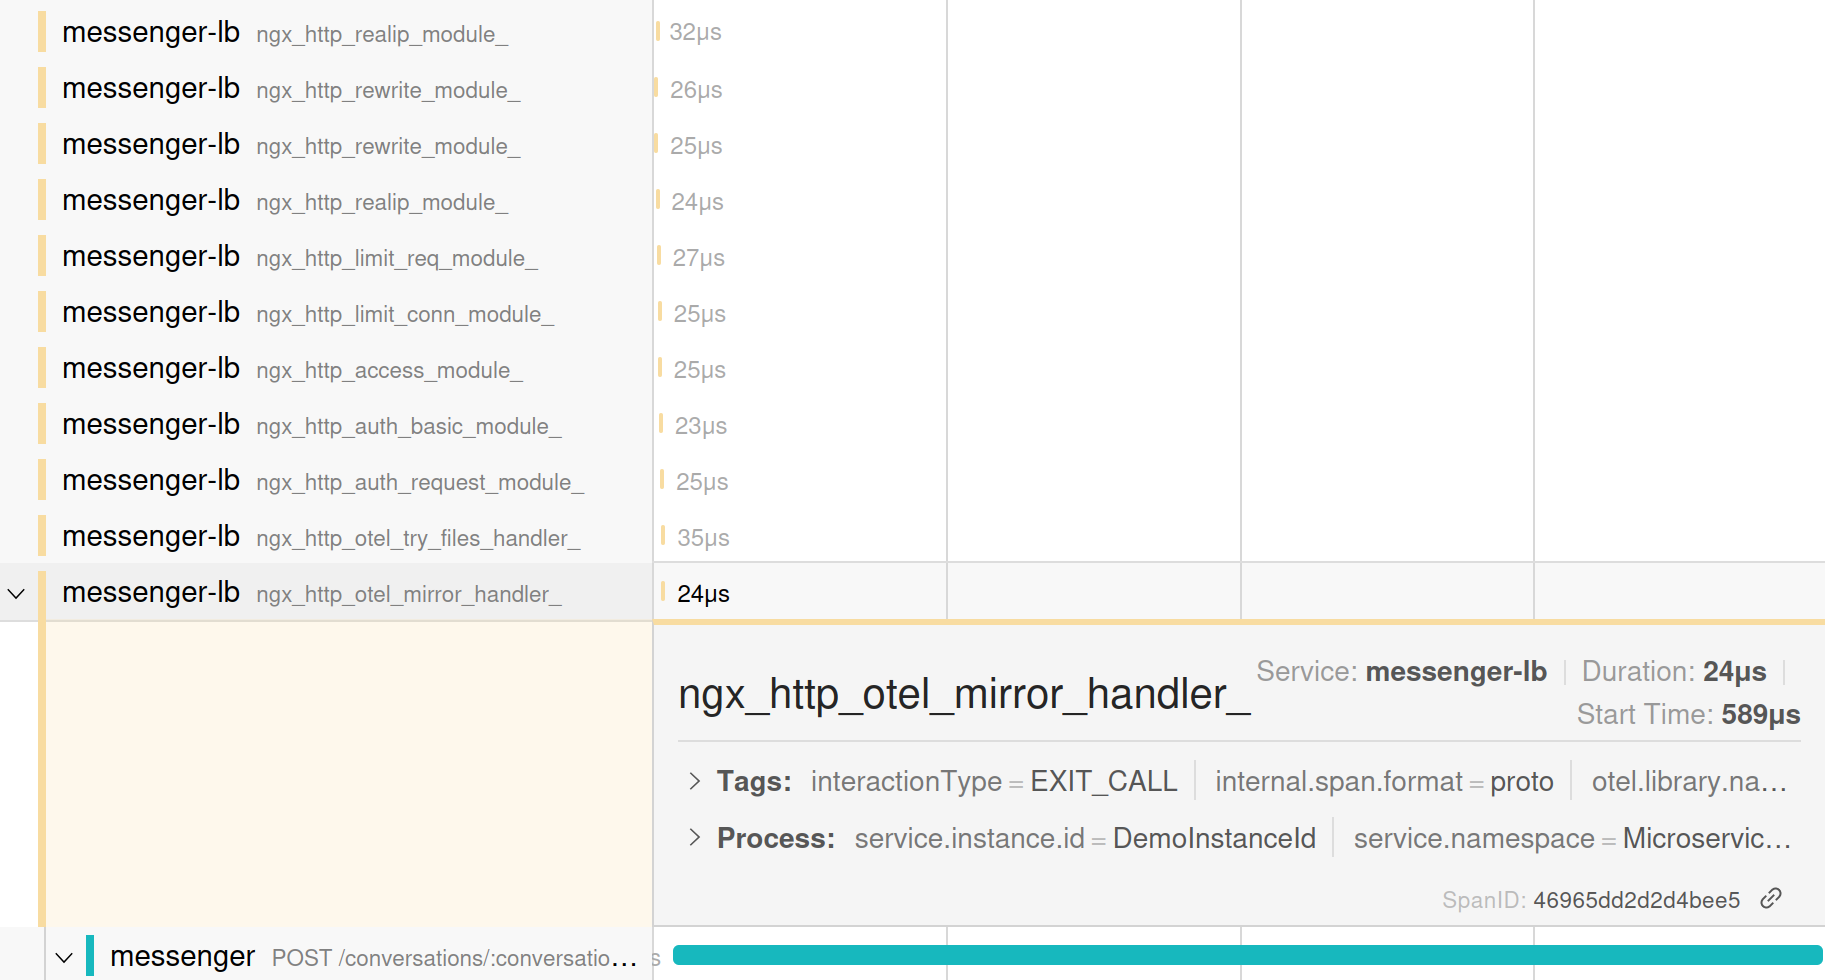
In a setup like this, for the most part the values are only useful relative to other measurements, and they vary between systems. In this case, though, this operation is clearly in no danger of approaching five seconds in length.
This information satisfies the goal because you can see that the NGINX operations didn’t take anywhere close to five seconds. If there is a very slow operation in the flow, it must be happening later on.
Goal 3: See How Long It Takes the notifier Service to Read the Event Dispatched by the messenger Service
The NGINX reverse proxy layer doesn’t include any information about this, so you can move on to the messenger spans.
Examine the messenger Section of the Trace
Goal 1: See All the Steps a Request Undergoes in the New Message Flow
The messenger service section of the trace contains another 11 spans. Again, most of the child spans concern the basic steps the Express framework uses when processing a request and are not very interesting. However, the parent span (the very first one) again contains some interesting insights:
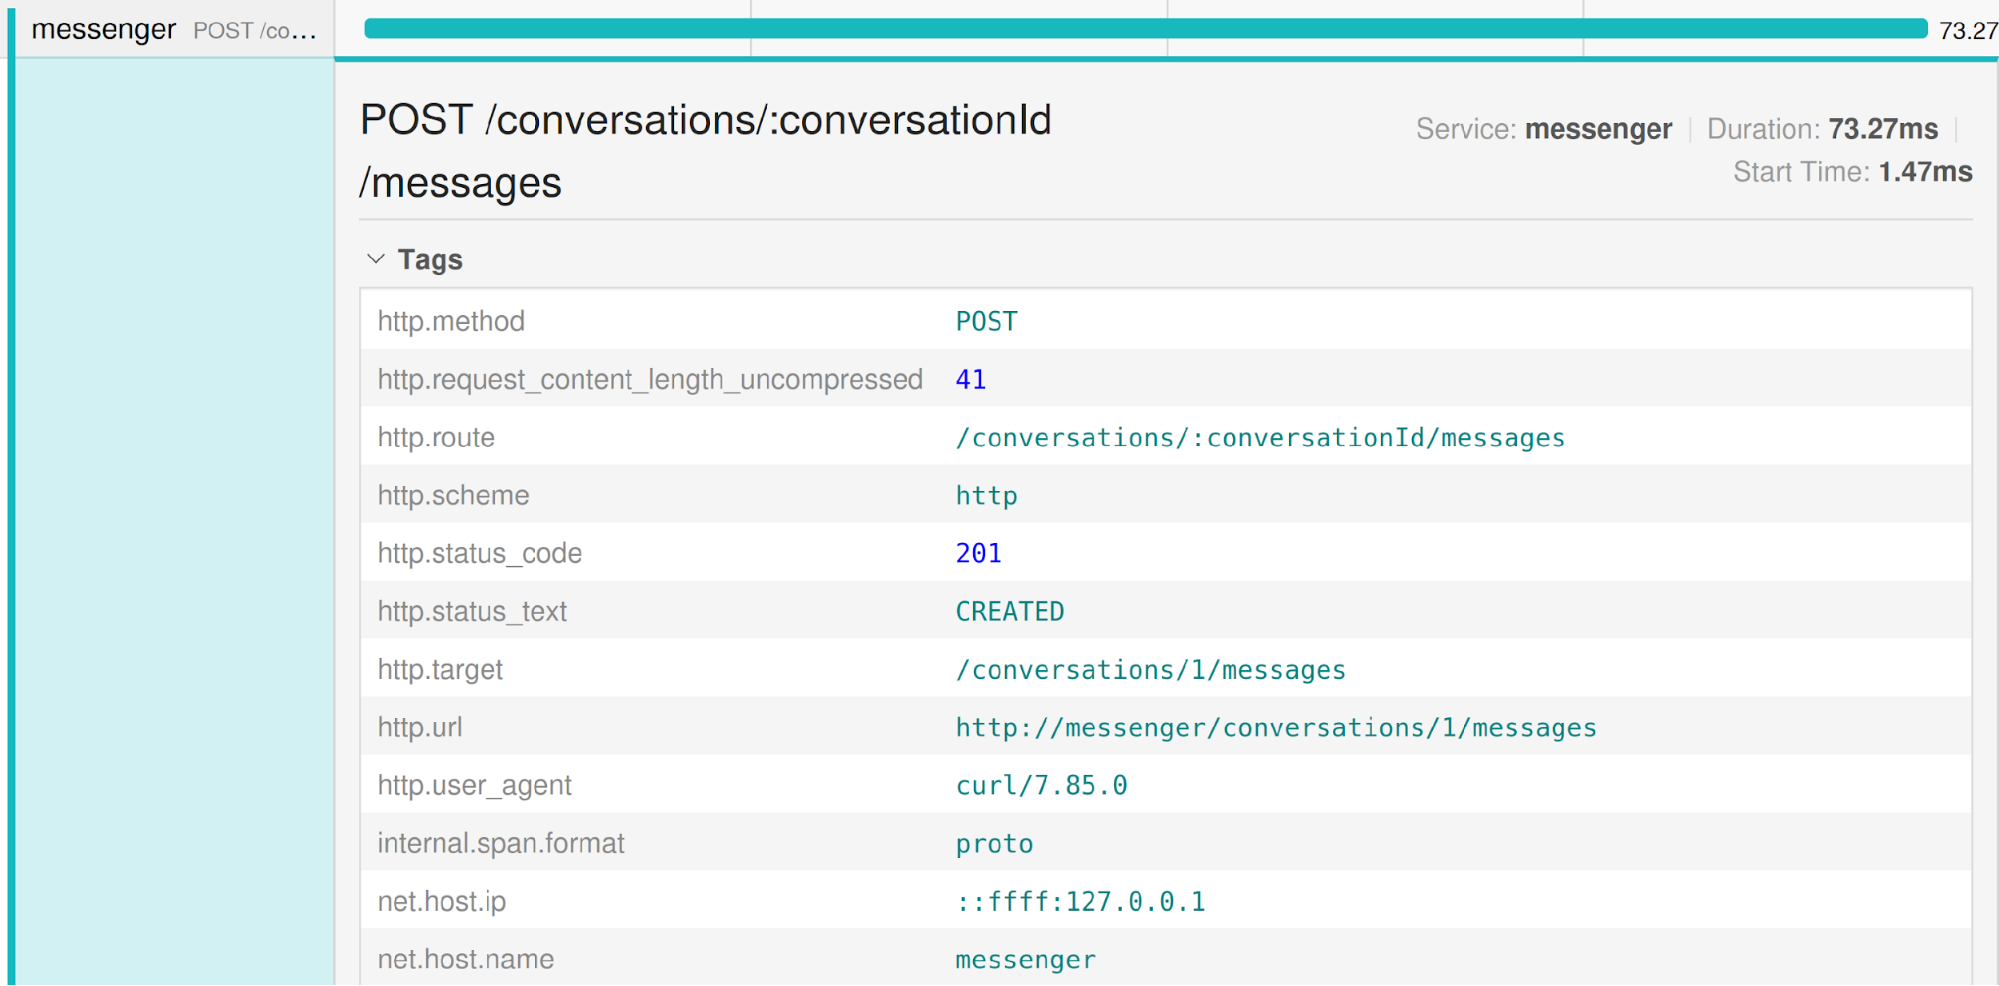
Under Tags you see the following attributes:
http.methodfield –POST(again, in REST terms this means creation)http.routefield –/conversations/:conversationId/messages(the message route)http.targetfield –/conversations/1/messages(the message endpoint)
This information satisfies the goal because it shows us that the messenger service was part of the flow and the endpoint hit was the new message endpoint.
Goal 2: Verify that the Flow Executes Within Five Seconds
As indicated in the following screenshot, the messenger portion of the trace started at 1.28ms and ended at 36.28ms, for an overall time of 35ms. Most of that time was spent parsing JSON (middleware - jsonParser) and, to a much greater extent, connecting to the database (pg-pool.connect and tcp.connect).
This makes sense given that several SQL queries are also made in the process of writing the message. That in turn suggests that you might want to augment the auto‑instrumentation configuration to capture the timing of those queries. (The tutorial doesn’t show this additional instrumentation, but in Challenge 4 you manually create spans which can in turn be used to wrap database queries.)
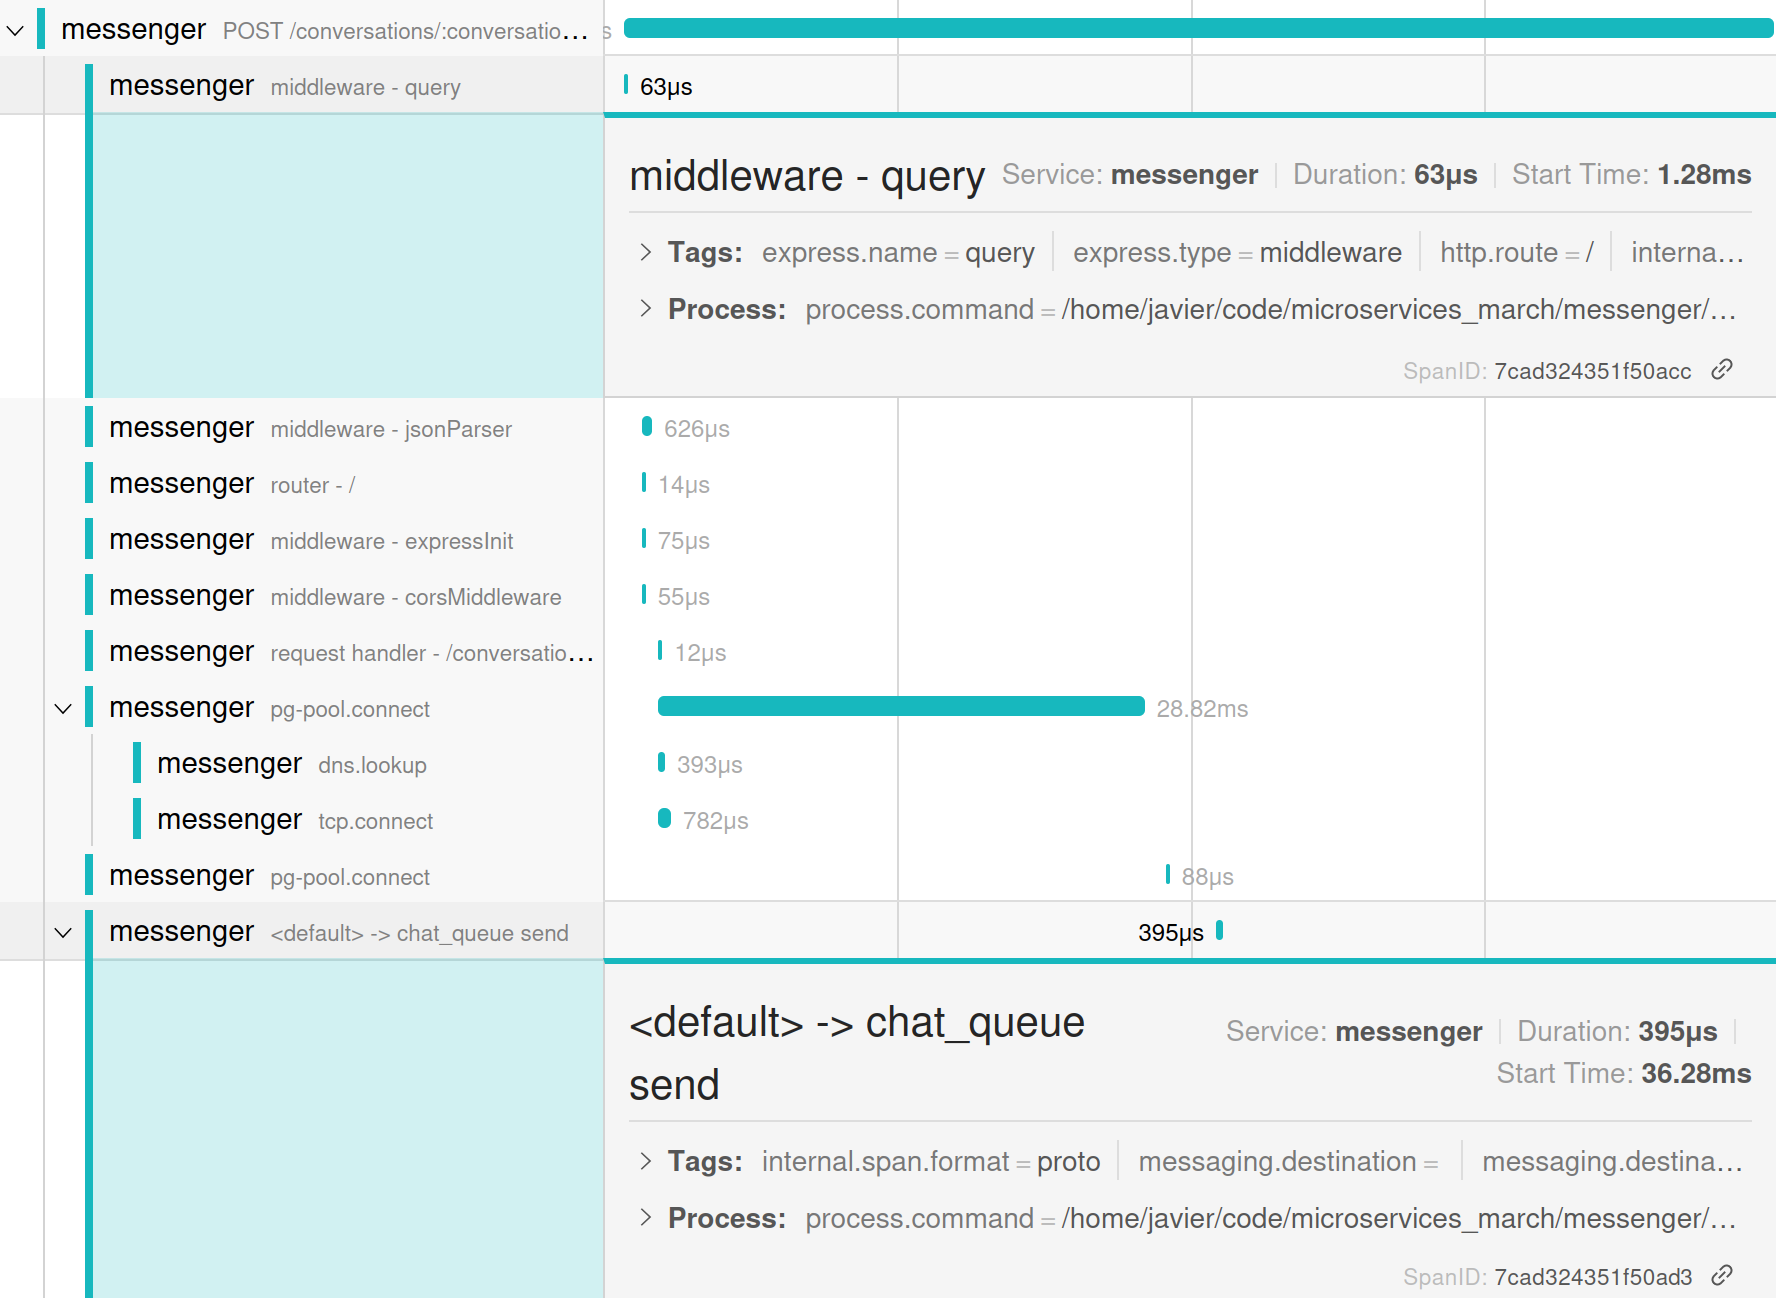
This information satisfies the goal because it shows that the messenger operations don’t take anywhere close to five seconds. If there is a very slow operation in the flow, it must be happening later on.
Goal 3: See How Long It Takes the notifier Service to Read the Event Dispatched by the messenger Service
Like the NGINX spans, the messenger spans don’t include this information, so you can move to the notifier spans.
Examine the notifier Section of the Trace
Goal 1: See All the Steps a Request Undergoes in the New Message Flow
The notifier section of the trace contains only two spans:

- The
chat_queueprocessspan – Confirms that the notifier service processed an event from the chat_queue message queue - The
pg-pool.connectspan – Shows that after processing the event the notifier service made some sort of connection to its database
The information available from these spans only partially fulfills the goal of understanding every step. You can see that the notifier service got to the point of consuming the event from the queue but you don’t know if:
- The message notification sent by this service corresponds to the event dispatched by the messenger service
- The relevant message notifications were correctly sent to the recipient of the message
This indicates that you need to do the following to fully understand the notifier service flow:
- Manually instrument the spans that show a notification being sent
- Ensure that there’s an explicit connection between the event dispatched by the messenger service and the event consumed by the notifier service, in the form of a trace ID
Goal 2: Verify that the Flow Executes Within Five Seconds
Looking at the overall timing of the notifier service spans, you see that the request spent 30.77ms in the notifier section of the flow. However, because there are no spans that signal the “end” of the whole flow (the sending of notifications to the recipient), you can’t determine the total timing of this section of the flow or the overall completion time for the operation.
Goal 3: See How Long It Takes the notifier Service to Read the Event Dispatched by the messenger Service
You can, however, see that a chat_queue process span for the notifier service started at 6.12ms, 2ms after a chat_queue send span started for the messenger service at 4.12ms.
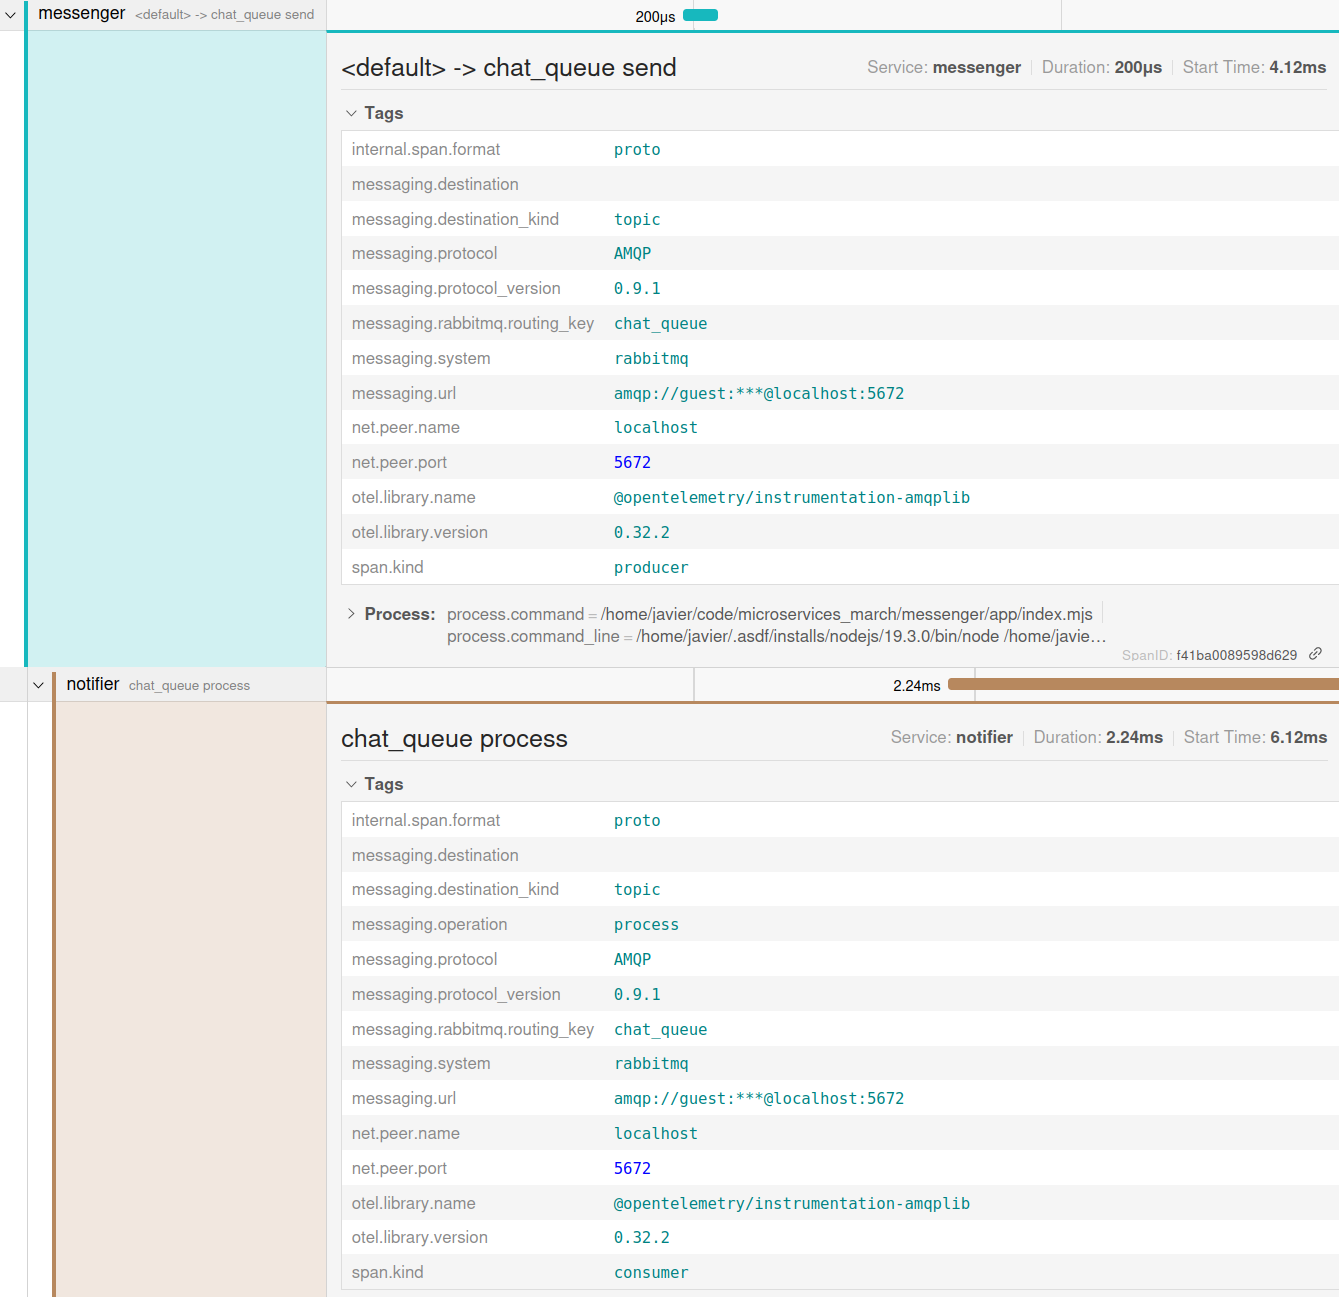
This goal is met because you know the notifier consumed an event 2ms after it was dispatched by the messenger service. Unlike goal 2, achieving this goal doesn’t require you to know whether the event was processed fully or how long that took.
Conclusions
Based on our analysis of the traces produced by the current OTel auto‑instrumentation, it’s clear that:
-
Many of these spans are not useful in their current form:
- NGINX is producing spans related to functions – such as authorization checking and file serving – that are not relevant to the role you care about, reverse proxying. However, at this point the OTel instrumentation for NGINX does not allow you to omit irrelevant spans, so nothing can be done.
- Among the spans for the Node.js services (the messenger and notifier services), some seem relevant to the goals: the spans for the JSON parsing,
requesthandler, and all database operations. Some of the middleware spans (likeexpressInitandcorsMiddleware) do not seem relevant and can be removed.
-
Critical spans are missing for the following:
- Notifications sent by the notifier service
- A clear mapping between the RabbitMQ event dispatched from the messenger service and the one processed by the notifier service
This means that the basic instrumentation fulfills the last goal:
- See how long it takes the notifier service to begin processing the event dispatched by the messenger service
However, there is not enough information to fulfill the first two goals:
- Understand all the steps a request undergoes during the new message flow
- Have confidence that the flow is executing end-to-end in less than five seconds under normal circumstances
Challenge 4: Optimize Instrumentation Based on Trace Readings
In this challenge, you optimize the OTel instrumentation based on the trace analyses you did in Challenge 3. This includes both removing unnecessary spans, creating new custom spans, and confirming that the event being consumed by the notifier service is the one generated by the messenger service.
Remove Unnecessary Spans
-
In your preferred text editor, open the tracing.mjs file in the app directory of the messenger repository and add the following at the end of the list of import statements at the top:
const IGNORED_EXPRESS_SPANS = new Set([ "middleware - expressInit", "middleware - corsMiddleware", ]);This defines a set of span names, derived from the list of spans shown in the following screenshot from the Jaeger UI, to be omitted from the trace because they provide no useful information for this flow. You might decide that other spans listed in the screenshot are also not needed, and add them to the list of
IGNORED_EXPRESS_SPANS.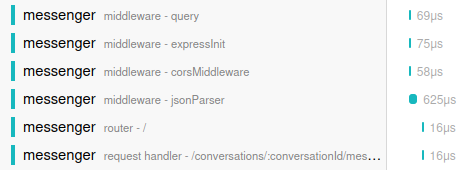
-
Add filters to the auto‑instrumentation configuration to omit spans you don’t want, by changing the line highlighted in orange:
const sdk = new opentelemetry.NodeSDK({ resource, traceExporter: new OTLPTraceExporter({ headers: {} }), instrumentations: [getNodeAutoInstrumentations()], });to this:
const sdk = new opentelemetry.NodeSDK({ resource, traceExporter: new OTLPTraceExporter({ headers: {} }), instrumentations: [ getNodeAutoInstrumentations({ "@opentelemetry/instrumentation-express": { ignoreLayers: [ (name) => { return IGNORED_EXPRESS_SPANS.has(name); }, ], }, }), ], });The
getNodeAutoInstrumentationsfunction references the set of spans defined in Step 1 to filter them out of the trace generated by@opentelemetry/instrumentation-express. In other words, thereturnstatement resolves totruefor a span that belongs toIGNORED_EXPRESS_SPANS, and theignoreLayersstatement removes that span from the trace. -
In the messenger terminal, press
Ctrl+cto stop the messenger service. Then restart it:^c node --import ./tracing.mjs index.mjs -
Wait about ten seconds, then in the client terminal send a new message:
curl -X POST -H "User-Id: 2" -H "Content-Type: application/json" -d '{"content": "This is the second message"}' 'http://localhost:8085/conversations/1/messages' -
Recheck the messenger spans in the Jaeger UI. The two
middlewarespans,expressInitandcorsMiddleware, no longer appear (you can compare it to the screenshot for Goal 2 of Examine the messenger Section of the Trace in Challenge 3.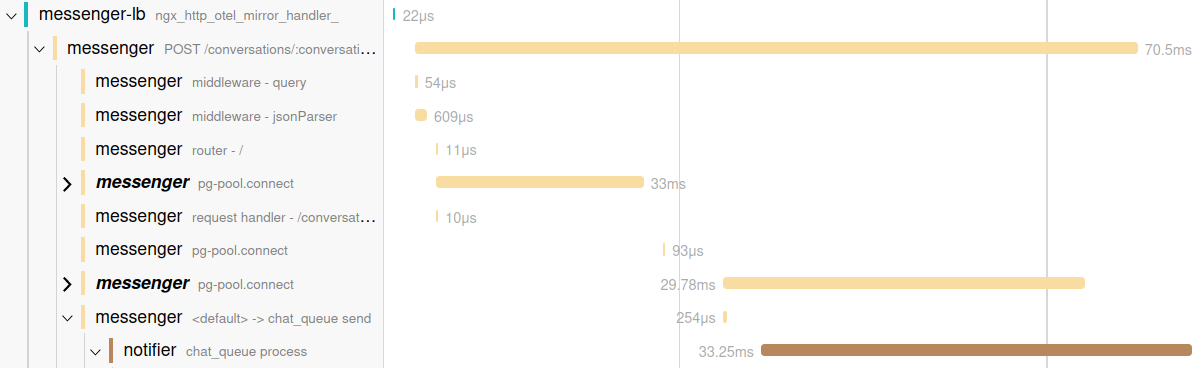
Set Up Custom Spans
In this section, you touch application code for the first time. Auto‑instrumentation generates quite a bit of information without requiring changes to the application, but some insights are possible only by instrumenting specific pieces of business logic.
For the new message flow you are instrumenting, an example of this is tracing the sending of notifications to the recipient of the message.
-
Open index.mjs in the app directory of the notifier repository. This file contains all of the business logic for the service. Add the following line at the end of the list of
importstatements at the top of the file:import { trace } from "@opentelemetry/api"; -
Replace this code (at about line 90 in the file):
for (let pref of preferences) { console.log( `Sending notification of new message via ${pref.address_type} to ${pref.address}` ); }with:
const tracer = trace.getTracer("notifier"); // 1 tracer.startActiveSpan( // 2 "notification.send_all", { attributes: { user_id: msg.user_id, }, }, (parentSpan) => { for (let pref of preferences) { tracer.startActiveSpan( // 3 "notification.send", { attributes: { // 4 notification_type: pref.address_type, user_id: pref.user_id, }, }, (span) => { console.log( `Sending notification of new message via ${pref.address_type} to ${pref.address}` ); span.end(); // 5 } ); } parentSpan.end(); // 6 } );The new code does the following at the indexed locations:
- Gets the
tracer, which is a global object for interacting with OTel traces. - Starts a new parent span called
notification.send_alland sets theuser_idattribute to identify the sender of the message. - Enters a loop where the notification preferences of the recipient are enumerated and a new child span called
notification.sendis created undernotification.send_all. Every notification generates a new span. -
Sets more attributes for the child span:
notification_type– One ofsmsoremailuser_id– The ID of the user receiving the notification
- Closes each child
notification.sendspan in turn. - Closes the parent
notification.send_allspan.
Having a parent span guarantees that each “send notification” operation gets reported even if no notification preferences are discovered for the user.
- Gets the
-
In the notifier terminal, press
Ctrl+cto stop the notifier service. Then restart it:^c node --import ./tracing.mjs index.mjs -
Wait about ten seconds, then in the client terminal send a new message:
curl -X POST -H "User-Id: 2" -H "Content-Type: application/json" -d '{"content": "This is the second message"}' 'http://localhost:8085/conversations/1/messages' -
Recheck the notifier spans in the Jaeger UI. You see the parent span and two child spans, each with a “send notification” operation:
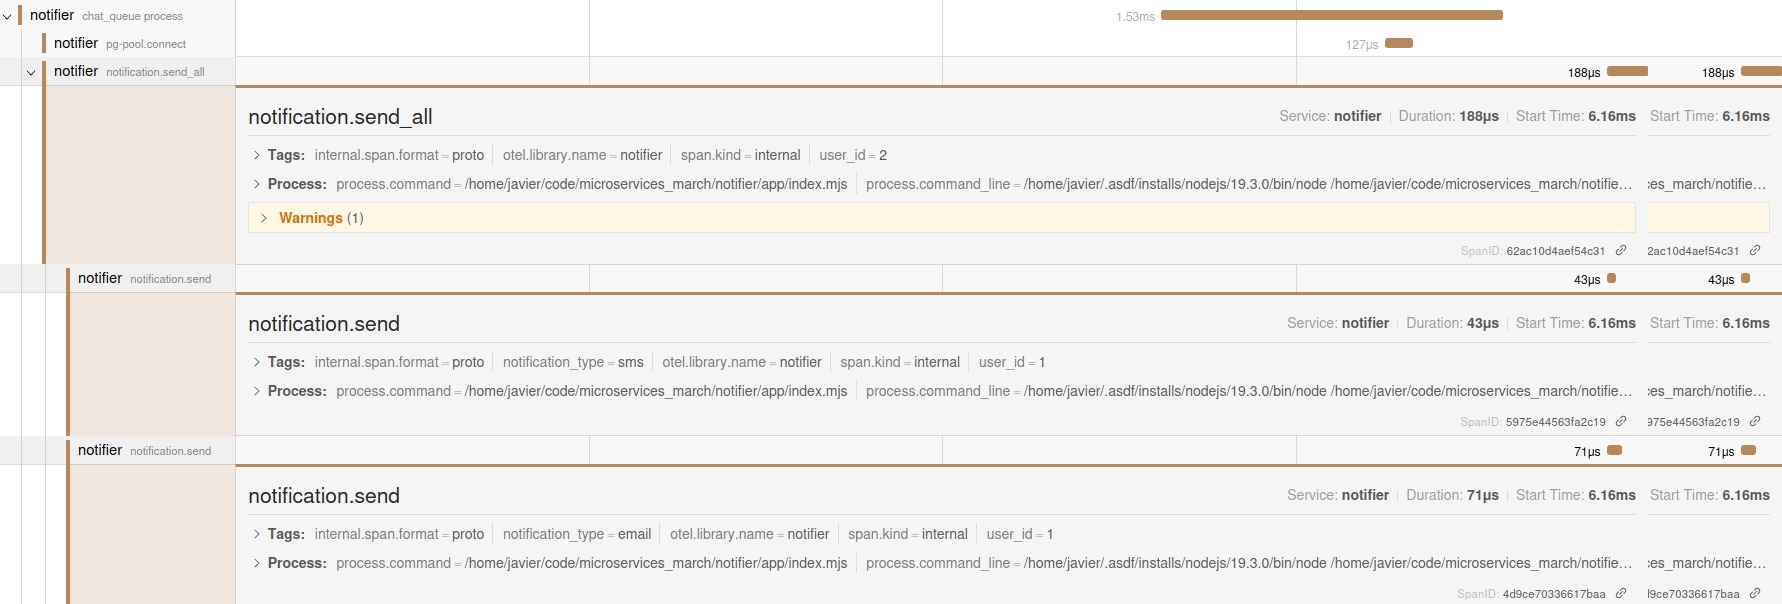
You can now fully accomplish the first and second goals, because you can see all the steps a request undergoes during the new message flow. The timings on each span expose any lag in between any of these steps.
Confirm the messenger and notifier Are Handling the Same Event
There is one more thing you need for full insight into the flow. Is the event being processed by the notifier service in fact the one dispatched by the messenger service?
You don’t have to make any explicit changes to connect the two traces – but you also don’t want to blindly trust the magic of auto‑instrumentation.
With that in mind, add some quick debug code to verify that the trace that starts in the NGINX service is indeed the same (has the same trace ID) as the one consumed by the notifier service.
-
Open the index.mjs file in the app directory of the messenger repository and make these changes:
-
Add the following line at the end of the list of import statements at the top:
import { trace } from "@opentelemetry/api"; -
Add the lines highlighted in orange below the existing line in black:
async function createMessageInConversation(req, res) { const tracer = trace.getActiveSpan(); console.log("TRACE_ID: ", tracer.spanContext().traceId);The new lines print out the
TRACE_IDfrom inside the function in messenger that handles the creation of a new message.
-
-
Open the index.mjs file in the app directory of the notifier repository and add the line highlighted in orange below the existing line in black:
export async function handleMessageConsume(channel, msg, handlers) { console.log("RABBIT_MQ_MESSAGE: ", msg);The new line prints the full contents of the AMQP event received by the notifier service.
-
Stop and restart the messenger and notifier services by running these commands in both the messenger and notifier terminals:
^c node --import ./tracing.mjs index.mjs -
Wait about ten seconds, then in the client terminal send a message again:
curl -X POST -H "User-Id: 2" -H "Content-Type: application/json" -d '{"content": "This is the second message"}' 'http://localhost:8085/conversations/1/messages' -
Look at the logs for the messenger and notifier services. The messenger service log includes a line like this which reports the trace ID for a message (the actual ID will be different when you run the tutorial):
TRACE_ID: 29377a9b546c50be629c8e64409bbfb5 -
Similarly, the notifier service log reports a trace ID in output like this:
_spanContext: { traceId: '29377a9b546c50be629c8e64409bbfb5', spanId: 'a94e9462a39e6dbf', traceFlags: 1, traceState: undefined }, -
The trace IDs match in the console, but as a final step you can compare them to the trace ID in the Jaeger UI. Open the UI at the relevant trace ID endpoint (yours will be different, but in this example it is http://localhost:16686/trace/29377a9b546c50be629c8e64409bbfb5) to see the whole trace. The Jaeger trace confirms that:
- The AMQP auto‑instrumentation in the messenger service adds this trace ID as part of the metadata when the event is dispatched.
- The AMQP auto‑instrumentation in the notifier service expects that metadata and sets the trace context appropriately.
Note: In a real production system, you would remove the code you added in this section once you confirmed the flow is working as expected.
Resource Cleanup
You have created a few containers and images throughout this tutorial! Use these instructions to remove them.
-
To remove any running Docker containers:
docker rm $(docker stop messenger-lb) -
To remove the platform service and the messenger and notifier database services:
cd ~/microservices-march/platform && docker compose down
cd ~/microservices-march/notifier && docker compose down
cd ~/microservices-march/messenger && docker compose down
Next Steps
Congratulations, you’ve completed the tutorial!
- You set up OTel instrumentation across an NGINX reverse proxy and two Node.js services.
- You looked at the data provided by OTel auto‑instrumentation with a critical eye and added some telemetry that was missing in order to achieve the OTel lab goals:
- You achieved a reasonable view of the flow of a specific request through a messaging system without directly changing any application code.
- You confirmed the flow was executing end-to-end in less than five seconds under normal circumstances.
And yet, you’ve barely scratched the surface of what an ideal tracing configuration might look like! In a production environment, you might want to add things like custom spans for each database query and additional metadata on all spans describing runtime details such as each service’s container ID. You could also implement the other two types of OTel data (metrics and logging) to give you a complete picture of the health of your system.
To continue your microservices education, check out Microservices March 2023. In Unit 4: Manage Microservices Chaos and Complexity with Observability, you’ll learn about the three principal classes of observability data, the importance of infrastructure and app alignment, and ways to start analyzing deep data.
The post NGINX Tutorial: How to Use OpenTelemetry Tracing to Understand Your Microservices appeared first on NGINX.
Source: NGINX Tutorial: How to Use OpenTelemetry Tracing to Understand Your Microservices


Leave a Reply