
Pandora FMS Integrates NGINX Plus Monitoring

NGINX manages large amounts of simultaneous connections with great performance. It’s being used successfully by a number of large-scale businesses, including our customers here at Pandora FMS. So Pandora FMS has added NGINX Plus as an exciting new feature in the Pandora FMS Enterprise stable.
The decision was clear: NGINX is used in large environments, Pandora FMS monitors large environments… We imagine you get the picture, but in case you don’t, see the figure below.
Bottom line, the team at Pandora has improved their existing plugin for open source NGINX to be compatible with NGINX Plus, allowing users to monitor a wide array of metrics from their advanced live activity feed. But, what does this imply?
Pandora FMS strives to work in perfect synchronization with NGINX. We want to capture and monitor as many parameters as users may need to gather from this service.
Monitor NGINX Plus Metrics with Pandora FMS Enterprise
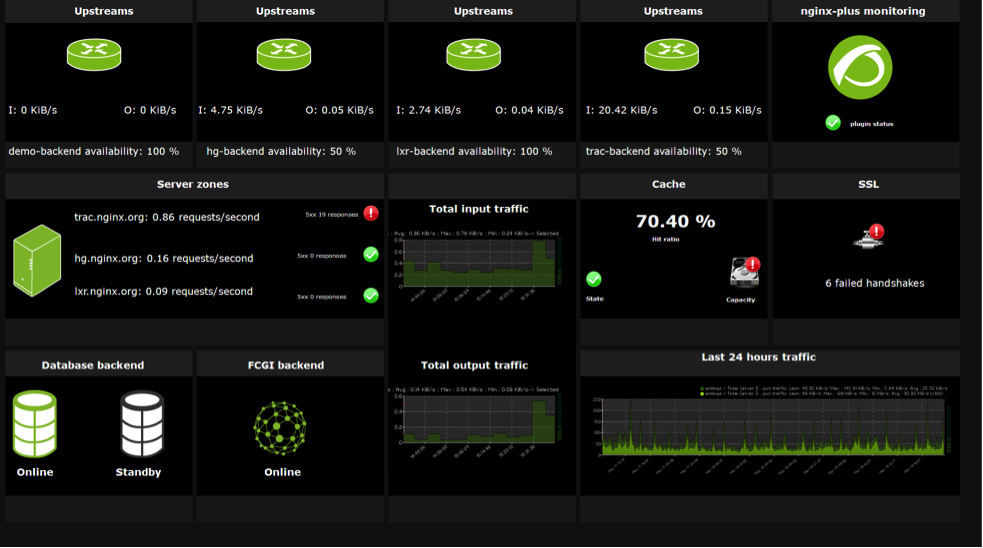
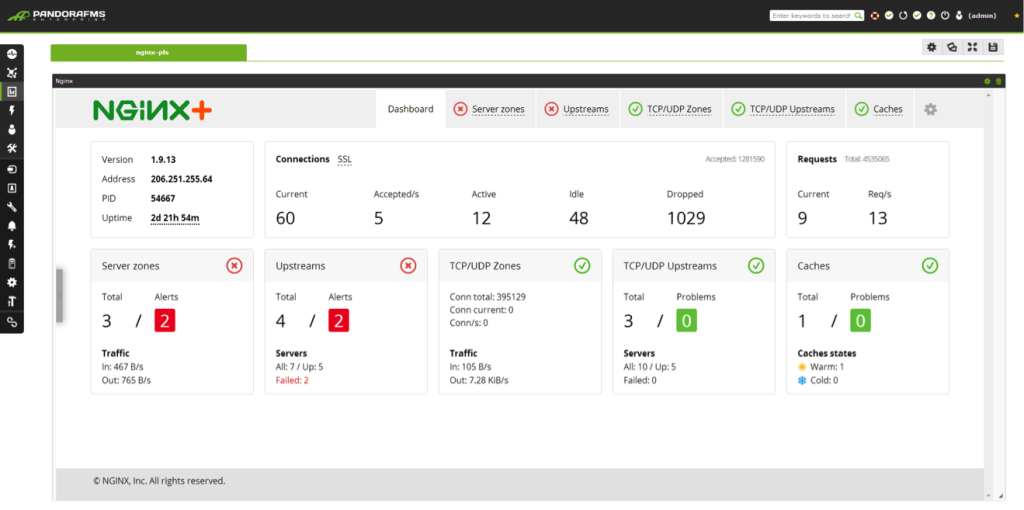
The new plugin gathers data from the NGINX Plus status module, including:
- Handled, dropped and active connections.
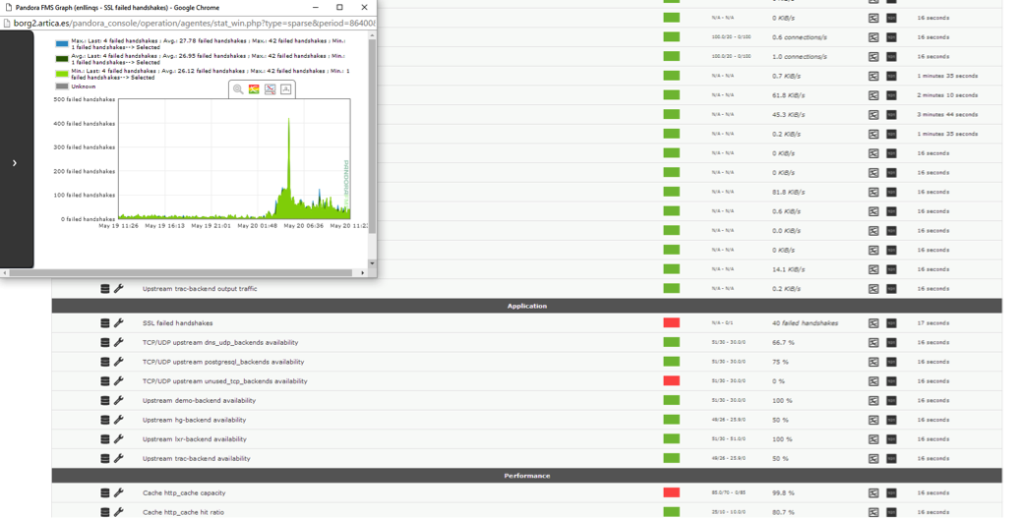
- For every Server Zone: I/O traffic, requests per second, and 2xx, 4xx, and 5xx response statuses.
- For every Cache: Status, hit ratio, and capacity.
- For every Upstream: Availability and I/O traffic.
- For every TCP/UDP Upstream and Zone: Availability, I/O traffic, and connections per second.
Setting up the NGINX Plus plugin for Pandora FMS Enterprise is really a breeze; there is no better way to illustrate this than with a short tutorial video.

Why Pandora FMS and NGINX Plus Make the Perfect Couple
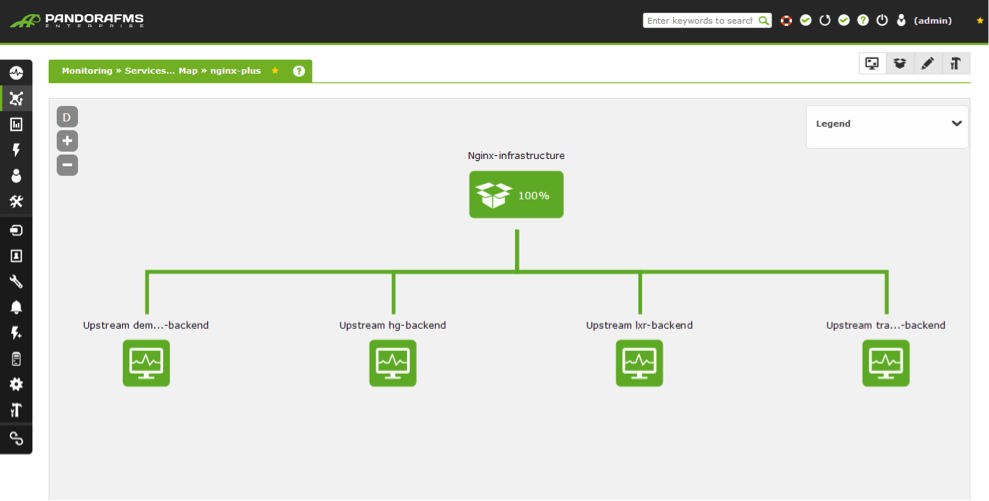
Pandora FMS and NGINX Plus work together smoothly and effectively. Pandora FMS enables monitoring NGINX Plus simultaneously with the rest of your infrastructure (databases, backends, etc.), providing key APM metrics to achieve end-to-end visibility as well as root-cause analysis.
Simultaneous monitoring of all “players” goes hand in hand with the visual real time dashboard integration that Pandora FMS provides for your environment, including your NGINX Plus parameters. This is not only useful, it’s also quite good looking.
The plugin can be adapted to measure all the metrics that NGINX Plus has, as well as custom metrics.
The plugin integrates fully with the dynamic features in NGINX Plus. So, what does this imply for you?
- Once you configure the plug-in, it will discover new NGINX components automatically; upstreams, caches, server zones, etc.
- On our roadmap is the ability to auto-scale, taking advantage of the on-the-fly capabilities provided by NGINX Plus.
This plugin is only available for Pandora FMS Enterprise edition users, and is meant for NGINX Plus specifically. However, if you want to monitor open source NGINX with Pandora FMS Open Source edition, check out this video tutorial on how to install Pandora FMS Open Source.
The post Pandora FMS Integrates NGINX Plus Monitoring appeared first on NGINX.


Leave a Reply