Setting Up NGINX Amplify in 10 Minutes
We recently released the free public beta of NGINX Amplify, our new cloud‑based tool that gives you visibility and control of NGINX and NGINX‑delivered applications. NGINX Amplify receives information from a small agent which you install on your NGINX servers. It provides configuration analysis for NGINX servers, graphs for specific metrics, dashboards that combine several metrics, and alerts.
This blog post is the first in a monthly series about how to install and use NGINX Amplify. In this first part, we walk you through the steps for creating an NGINX Amplify account and installing the agent on each of your NGINX servers. Then, we show you how to get started using NGINX Amplify, including setting up an initial set of graphs, creating a simple dashboard, setting up an alert, and stepping through the configuration analysis.
In later blog posts, we’ll go more deeply into each of these capabilities, putting you well on the way to becoming an NGINX Amplify expert.
For more details about NGINX Amplify, see our previous blog posts, our recorded webinar, and the official documentation on GitHub.
Before You Begin
You can help NGINX Amplify work optimally from the start. Perform the following steps before you sign up:
- Check that you are using a supported Linux distribution. As of this writing, supported distributions include Amazon Linux, CentOS, Debian, Red Hat Linux, and Ubuntu.
- Check that your Python version is supported; as of this writing, Python version 2.6 and 2.7 are supported – Python 3 is not.
-
To get a full range of metrics:
- For open source NGINX, configure the Stub Status module.
- For NGINX Plus, which delivers additional metrics, configure the extended Status module instead.
- Make sure the directory and the configuration file where
stub_statusis defined are readable by the NGINX Amplify agent; if so, the agent will access them automatically. - For even more metrics, make a few simple changes to your log format configuration and reload NGINX for the changes to take effect.
Create an NGINX Amplify Account
Creating an NGINX Amplify account gives you access to the cloud‑based software behind NGINX Amplify. However, nothing actually gets monitored until you install the agent on each of your NGINX servers, as described in Install the NGINX Amplify Agent on Your Servers below.
Follow these steps to create your NGINX Amplify account:
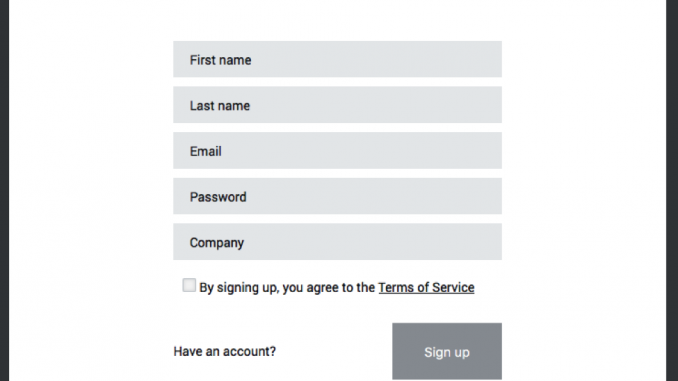
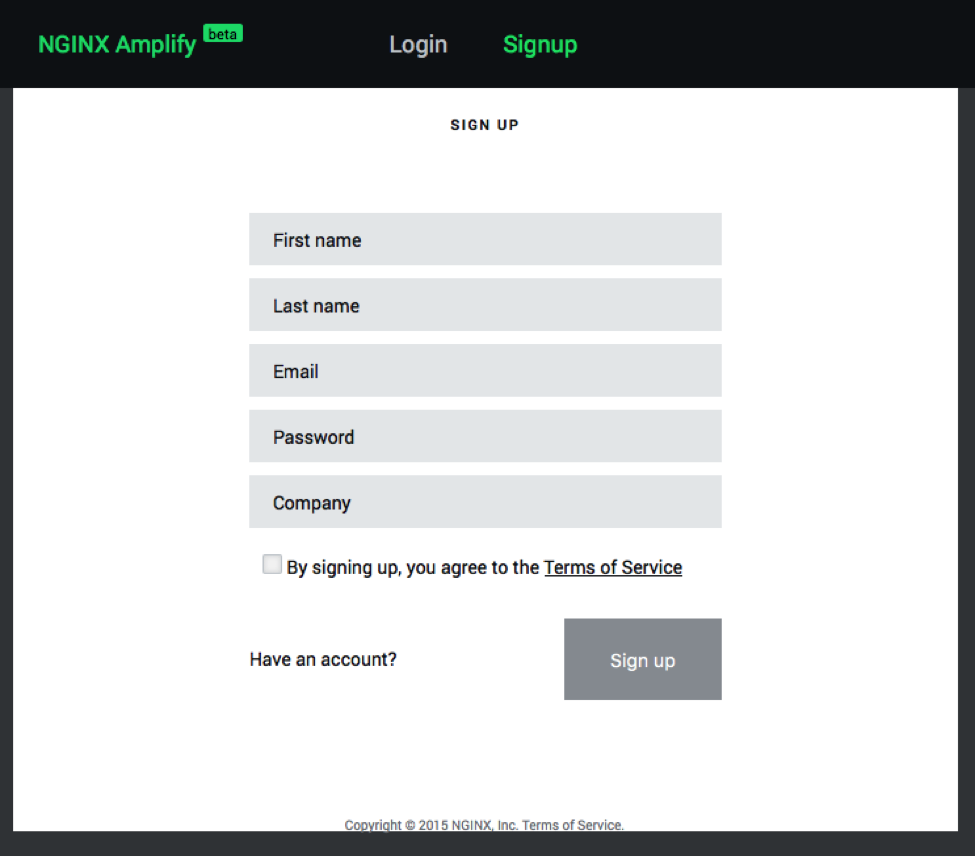
- Visit the NGINX Amplify signup page.
- Fill in the form and agree to the Terms of Service.
-
Click Sign up.

Figure 1. Enter your contact details on the NGINX Amplify Sign‑up screen - In the dialog that appears, fill in the additional information about yourself. Click Next.
Congratulations! You now have access to NGINX Amplify.
Note: If you have problems using NGINX Amplify, click the question mark (?) icon in the lower right of the main screen to communicate directly with our team. You may also receive automated suggestions from the team as you install NGINX Amplify and start using it.
The next section explains how to install the agent on your NGINX servers.
Install the NGINX Amplify Agent on Your Servers
The instructions for adding a server to NGINX Amplify appear on‑screen after you create your account, as described in the previous section. You can also view the instructions:
- By clicking the + New System button in the bottom left corner of the main login screen
- In the NGINX Amplify documentation
- In this blog post
Follow these steps on each of your servers to install the NGINX Amplify agent:
- Either log into the server as root, or use the
sudocommand (which requires that the local sudoers policy grants you root privileges). -
Run this command to download the installation script:
# curl -L -O https://github.com/nginxinc/nginx‑amplify‑agent/raw/master/packages/install.sh -
Run the
install.shscript using your API_KEY; make sure to copy and paste the actual API_KEY from the on‑screen instructions. For example:# API_KEY='1234567890abcdef' sh ./install.shThe installation script runs automatically and sends output to your terminal as it progresses through roughly 15 steps. The NGINX Amplify agent then starts running.
- After about a minute, check that the server appears in the Systems area of the Graphs page.
- Repeat the procedure above for all servers that need monitoring.
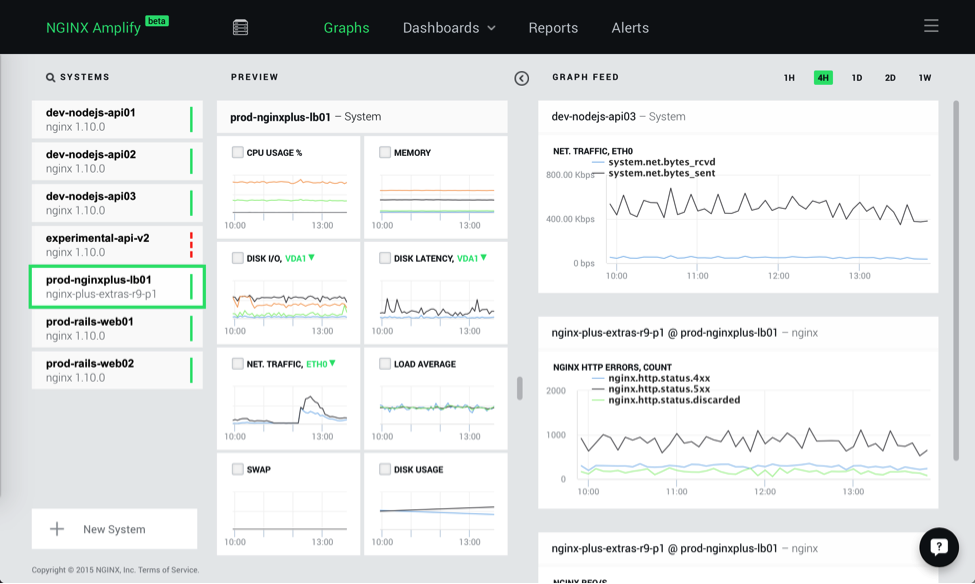
As you add servers, graphs appear in the Preview area of the Graphs page with predefined metrics for each server. Within a few minutes, the graphs begin populating with the collected statistics.
When you click a system name in the Systems area of the Graphs page, small versions of graphs for that system appear in the Preview area. You can then click on a small graph to see a larger version in the Graph Feed area on the right. Expand your browser window to see larger versions of the graphs in the Graph Feed area.
After adding a few systems, your NGINX Amplify screen looks something like the following.
Note: You can add the NGINX Amplify agent to servers that don’t run NGINX or NGINX Plus if you find it convenient to do so. However, the information that NGINX Amplify provides for such servers is minimal.
Create a Dashboard for Monitoring
On the NGINX Amplify Dashboards page, you can configure custom graphs to report metrics of your choice. You can perform various operations on the incoming data, including filtering, summation and averaging of multiple metrics, and more. Use dashboards to monitor specific servers, groups of servers, specific microservices, entire applications, and more.
As an example, follow these steps to create an initial dashboard showing requests resulting in HTTP status code 401 Unauthorized :
- On the Dashboards page, click Create Dashboard.
- Click Add Graph.
- Enter a Title for your graph, such as 401 Errors.
-
Choose the relevant metric from the drop‑down menu; in this case, it’s nginx.http.status.4xx.
Tip: Type in a character string to reduce the list of metrics to those that include the string you enter. For instance, you can type system to restrict the list to system metrics, or type nginx to restrict the list to NGINX metrics.
- Choose an NGINX instance from the drop‑down menu labeled Click to select NGINX.
- To apply a filter to the metric, click Apply filter. Unless the filter is applied, the graph will just display the combined number of
4xxerrors. - Click the drop‑down menu that appears, Click to select filter key. Choose the key value from the list; since we are filtering by HTTP status code in this scenario, it’s $status.
- Click Type or select filter value. Type 401, then choose the line, Use 401 as value, which appears underneath. (The filter doesn’t take effect if you type a value without selecting the line that appears.)

Figure 3. Specifications for a new NGINX Amplify graph, ready to save. - When you have filled in all fields with appropriate values, the Save button activates (turns green). Click it.
- The graph appears on a new dashboard; it will be unpopulated until events that meet the filter conditions have occurred. To name the dashboard, click the default name (Untitled…), click Edit, and type the new name.

Add an Alert
Alert rules let you know when the value of a metric goes outside a range that you define. Properly set up, alerts can give you peace of mind, because you know about the unexpected server behavior very quickly. In some cases, an alert can tell you about a problem before it becomes visible to users; in other cases, an alert can ensure that, when a problem is becoming visible to users, you’re not the last to know.
Two caveats:
- You can’t create alerts based on summaries or averages across a set of systems.
- Alerts are not filtered by hostname by default, so an alert tells you when any system goes outside your target range. To make an alert host‑specific, specify the hostname when configuring the alert.
Note: Every NGINX Amplify account has one predefined alert: you are alerted if NGINX Amplify goes down for more than two minutes. Remove this alert if you don’t need it.
Follow these steps to create an alert for checking a threshold for bytes in:
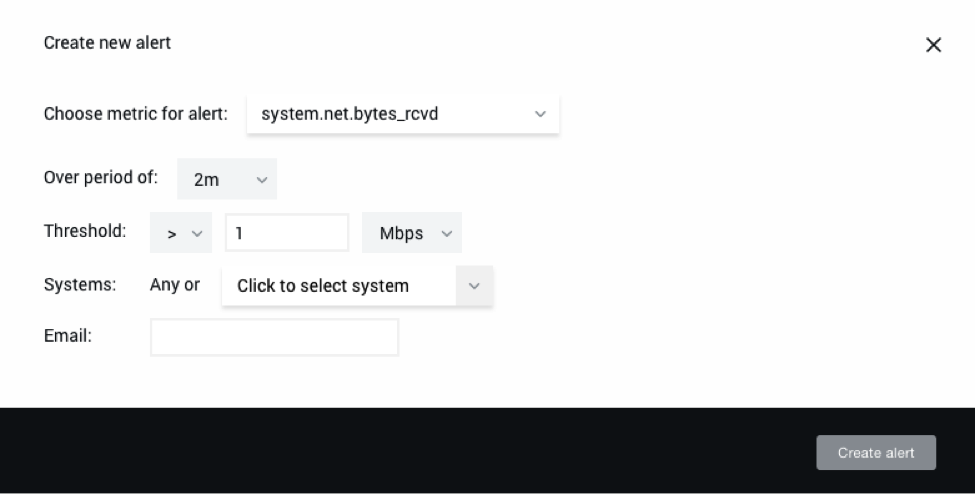
- On the Alerts page, click Add new alert. The Create new alert dialog appears.
- Choose a metric, a period of time, and a threshold value to compare the metric against. In Figure 5, we’ve created an alert when the inbound traffic exceeds 1 Mbps for more than 2 minutes.
- Optionally, specify which Systems the alert applies to.
- Enter the Email address to notify when the alert is triggered. If the email address has not been previously used with NGINX Amplify, the system sends a verification email.
- Click Create alert.
Generate a Report About a System Configuration
When you install the agent software on a server, NGINX Amplify analyzes your configuration and generates a detailed report. The report includes status information and configuration advice:
- Status information. The current state of your NGINX instance, including the NGINX version, an overview of your configuration (including modules), security advisories, virtual servers, and SSL/TLS information.
- Configuration advice. An analysis of your configuration that provides recommendations to improve the performance, security, and reliability of your NGINX‑delivered applications.
When you install the NGINX Amplify Agent on a system, we recommend that you review all sections of the report for actionable items, as follows:
- Version and Overview – Make sure there are no surprises, and address them if there are. We recommend that you move to the most recent version of NGINX or NGINX Plus for optimal performance and security.
- Security – Review and address all security advisories, as applicable.
- Virtual servers – Review Virtual servers to see a breakdown of configured servers and, if relevant, SSL/TLS information.
- SSL – Check the status of your SSL certificates and make sure nothing has expired. If you don’t want this analysis in the Reports, disable it in the Settings menu.
- Static analysis – Review and address all warnings as needed.

In a future blog post, we’ll go into depth about how to use the information on the Reports page.
Summary
We’re happy to provide this introduction to NGINX Amplify. We’ve shown you how to sign up, download the NGINX Amplify agent for each covered system, and set up initial graphs, dashboards, and alerts – as well as how to quickly evaluate the reports you get for each system. Our hope is that this blog post encourages you to sign up, or shows you how to get the most out of NGINX Amplify if you’ve already done so.
Future blog posts will go into more depth about how to get the most out of NGINX Amplify. We look forward to your using NGINX Amplify, and to your feedback about how to improve it further.
Use the ? icon in NGINX Amplify to provide feedback, or send us a message in the Comments section below.
The post Setting Up NGINX Amplify in 10 Minutes appeared first on NGINX.


Leave a Reply