Using NGINX Amplify Custom Dashboards and Filters for Better NGINX Monitoring
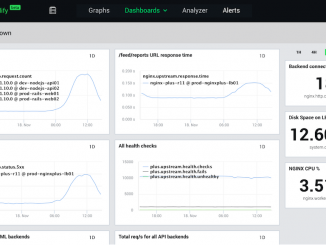
Using NGINX Amplify Custom Dashboards and Filters for Better NGINX Monitoring This blog post is the third in a series about how to monitor NGINX and make the most out of your web delivery infrastructure with NGINX Amplify: Setting Up NGINX Amplify in 10 Minutes Improving Server Configuration with NGINX Amplify Reports Using NGINX Amplify Custom Dashboards and Filters for Better NGINX Monitoring (this post) In a recent blog post, we introduced and briefly described custom dashboards. This blog post describes how you can use custom dashboards and filters to focus in on the metrics that most exactly indicate how well NGINX and your applications are functioning. By alerting you of potential outages and performance bottlenecks, the improved monitoring data helps you improve uptime and NGINX performance. Architectural Components of NGINX Amplify The dashboards and filters in NGINX Amplify interact with these other NGINX Amplify [ more… ]