Troubleshooting Application Performance and Slow TCP Connections with NGINX Amplify
I’m going to share an example of using NGINX Amplify as a visualization and reporting tool for benchmarking application performance. The primary focus is going to be measuring the performance of a keepalive connection technique.
As you’ll see at the conclusion, we found that we can double performance in a realistic testing scenario by using TCP keepalive. Using the NGINX upstream keepalive mechanism reduces connection overhead, by reducing the number of TCP/IP packet round trips, and also gives more consistent response time. Using NGINX Amplify, we’re able to easily visualize the interaction, identify bottlenecks, and troubleshoot excessive TCP connect time, improving application performance.
Introduction
Keepalive connections can significantly boost performance, but only if they’re reused extensively, sharply reducing the need to create new connections, which are computationally expensive to set up. The performance boost from using keepalives is increased when SSL/TLS is in use, as SSL/TLS connections are even more expensive than non-secure connections. (In fact, because keepalives can so greatly reduce the performance penalty otherwise incurred when using SSL/TLS, the extensive use and reuse of keepalives can make the difference as to whether SSL/TLS use is practical or impractical on a website.)
The HTTP Keepalive Connections and Web Performance blog post covers a variety of topics related to the internals of the TCP protocol, as well as a number of common problems, and how to troubleshoot them – including a useful definition of keepalive connections:
HTTP uses a mechanism called keepalive connections to hold open the TCP connection between the client and the server after an HTTP transaction has completed. If the client needs to conduct another HTTP transaction, it can use the idle keepalive connection rather than creating a new TCP connection. Clients generally open a number of simultaneous TCP connections to a server and conduct keepalive transactions across them all. These connections are held open until either the client or the server decides they are no longer needed, generally as a result of an idle timeout.
The Overcoming Ephemeral Port Exhaustion in NGINX and NGINX Plus blog post describes the NGINX configuration part, basically how to make NGINX reuse previously established TCP connections to upstreams:
A keepalive connection is held open after the client reads the response, so it can be reused for subsequent requests. Use the keepalive directive to enable keepalive connections from NGINX Plus to upstream servers, defining the maximum number of idle keepalive connections to upstream servers that are preserved in the cache of each worker process. When this number is exceeded, the least recently used connections are closed. Without keepalives, you’re adding more overhead, and being inefficient with both connections and ephemeral ports.
Also, in the 10 Tips for 10x Application Performance blog post, there’s some general information about the usefulness and applicability of the client-side keepalive and upstream-side keepalive techniques. Please note that you should use and manage client-side keepalives and upstream keepalives differently:
- Client-side keepalives – Client-side keepalive connections reduce overhead, especially when SSL/TLS is in use. For NGINX, you can increase the maximum number of
keepalive_requestsa client can make over a given connection from the default of 100, and you can increase thekeepalive_timeoutto allow the keepalive connection to stay open longer, resulting in faster subsequent requests. - Upstream keepalives – Upstream connections (connections to application servers, database servers, and so on) benefit from keepalive connections as well. For upstream connections, you can increase
keepalive, the number of idle keepalive connections that remain open for each worker process. This forms a pool of upstream keepalive connections, allowing for increased connection reuse and cutting down on the need to open new connections. The keepalive blog post mentioned above and the NGINX developer’s forum provide technical insights on how to use the upstream keepalive connection pool to optimize application performance.
There are two basic cases where the upstream keepalive pool is really beneficial:
- The application infrastructure has fast application backends that produce responses in a very short time, usually comparable to the speed of completing a TCP handshake. This is because the cost of the TCP handshake is high in relation to the cost of the response.
- Application infrastructure has remote backends (when seen from the NGINX proxy perspective) and therefore high network latency, as a TCP handshake takes a long time.
There are also some other beneficial side effects of using upstream keepalive, which include reducing the number of sockets in TIME-WAIT state, less work for the OS to establish new TCP connections, and fewer packets on the network. However, these are unlikely to result in measurable application performance benefits in a typical setup.
Testing Setup
While using keepalives can be useful, the configuration part is usually a bit complex and error prone. We‘ll use Wireshark to inspect the low-level network elements, such as TCP streams and their connection states.
In order to measure the TCP connection time, we’ll configure an NGINX container with the NGINX Amplify agent to collect all necessary data. We’ll then use NGINX Amplify to analyze this data. We’ll use siege as the HTTP benchmarking tool with the following configuration (~/.siege/siege.conf):
protocol = HTTP/1.1

cache = false

connection = keep-alive

concurrent = 5

benchmark = true
You may notice that connection = keep-alive above, which means that the client will use the client-side HTTP keepalive mechanism. Having it configured that way, we demonstrate that there are two distinct TCP connections – two TCP streams, to be precise – when proxying a request. One is the client-side HTTP keepalive connection to the NGINX proxy, and the other one is the connection between NGINX and the upstream backend. The latter is part of NGINX keepalive connection pool. In the remainder of this blog post, we’ll talk about the upstream keepalive only.
We’ll begin with showing the benchmark results in the NGINX Amplify dashboard first, and we’ll explain them afterwards. This will give you some context about the focus of this exercise.
The testing scenario is: sequential siege tests started from inside the NGINX container, with each test taking 10 minutes to finish:
 -b -t 10m http://127.1/upstream-close/proxy_pass_connection-close/server_keepalive_timeout-0

siege -b -t 10m http://127.1/upstream-close/proxy_pass_connection-keepalive/server_keepalive_timeout-0

siege -b -t 10m http://127.1/upstream-close/proxy_pass_connection-keepalive/server_keepalive_timeout-300

siege -b -t 10m http://127.1/upstream-keepalive/proxy_pass_connection-keepalive/server_keepalive_timeout-0

siege -b -t 10m http://127.1/upstream-keepalive/proxy_pass_connection-keepalive/server_keepalive_timeout-300
In this case, we broke a rule of performance testing by running the load generator on the system under test, with the risk of distorting the results. To reduce this effect, we isolated resource use by running and inspecting the traffic in Docker containers, and there weren’t many locking operations such as I/O, which both use lots of time and have significant variability unrelated to the system aspects being tested. The fact that the results were pretty consistent seems to indicate that we were able to get relatively “clean” results.
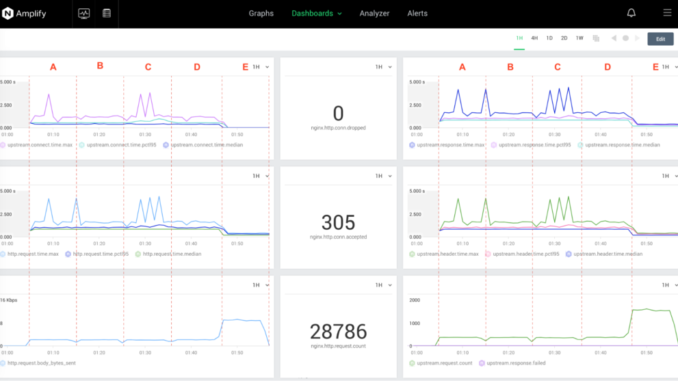
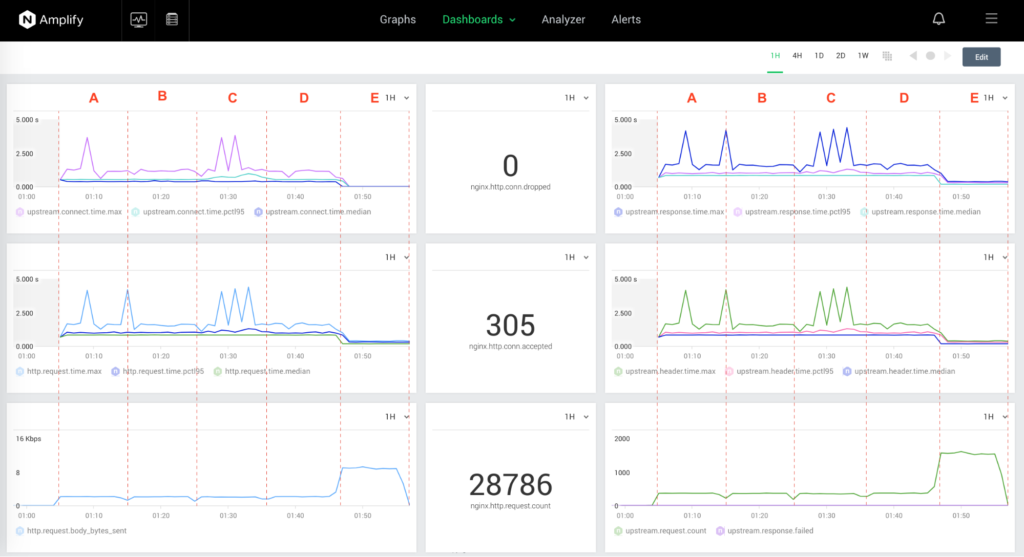
The NGINX Amplify dashboard below contains six graphs, with the metrics presented as 50pctl (median), 95pctl, and max. The following metrics are collected and visualized:
nginx.upstream.connect.timenginx.http.request.timenginx.http.request.body_bytes_sentnginx.upstream.response.timenginx.upstream.header.timenginx.upstream.request.count
The first four graphs below contain metrics where the lower values represent better performance. The bottom two graphs describe the traffic, where the bigger the volume is, the better.

The next diagram shows the two most important metrics describing the upstream keepalive performance: nginx.upstream.connect.time and nginx.upstream.header.time:

The Amplify agent is installed inside the NGINX container, see the official repo:
docker run --net network0 --name nginx -p 80:80 -e API_KEY=$AMPLIFY_API_KEY -d nginx-amplifyEvery siege benchmark run requires two TCP streams: siege NGINX, and NGINX upstream backend server). We analyzed the upstream keepalive TCP streams in each of the following configuration scenarios – this GitHub gist contains the NGINX configuration snippets and the Wireshark dumps.
Scenarios A, B, and D have been tested against an upstream backend server (also running NGINX) configured as follows:
server { location / { empty_gif; keepalive_timeout 0; } }Scenarios C and E have been tested against an upstream backend NGINX server configured as follows:
server { location / { empty_gif; keepalive_timeout 300; keepalive_requests 100000; } }To run Wireshark, we use a tcpdump Docker container and a copy of Wireshark installed on MacOS:
docker run --net=container:nginx crccheck/tcpdump -i any --immediate-mode -w - | /usr/local/bin/wireshark -k -i -;[h2]Test Results[/h2]
Let’s take a look at the TCP streams between the NGINX proxy and the upstream server for each of the above-mentioned scenarios.
A: upstream: close, proxy_pass_connection: close, server_keepalive_timeout: 0

B: upstream: close, proxy_pass_connection: keepalive, server_keepalive_timeout: 0

C: upstream: close, proxy_pass_connection: keepalive, server_keepalive_timeout: 300

D: upstream: keepalive, proxy_pass_connection: keepalive, server_keepalive_timeout: 0

E: upstream: keepalive, proxy_pass_connection: keepalive, server_keepalive_timeout: 300

According to RFC-793 Section 3.5: A TCP connection may terminate in two ways: (1) the normal TCP close sequence using a FIN handshake, and (2) an “abort” in which one or more RST segments are sent and the connection state is immediately discarded. If a TCP connection is closed by the remote site, the local application MUST be informed whether it closed normally or was aborted.
Wireshark I/O graph: TCP congestion window (dark green) and bytes in flight (light green):

Now we can see that the upstream keepalive configuration has to contain an upstream keepalive, a proxy connection header as an empty string, with proxy protocol HTTP/1.1. The upstream backend server should support HTTP keepalive too, or else TCP connections are closed after every HTTP request.
With the above, we saw the results of benchmarking against an idle server (located on AWS, EU West -> US West), and now we’re going to perform the same procedure for a heavy loaded server (AWS, EU West -> US West). Let’s perform the same benchmark for two more test cases.
Test Results Under Load
The next testing scenario is sequential siege run from inside the NGINX container. Each run takes about 20 minutes to finish:
siege -b -t 20m http://127.1/upstream-heavy-loaded-close/

siege -b -t 20m http://127.1/upstream-heavy-loaded-keepalive/
The value of nginx.upstream.connect.time (the max value out of the statistical distribution collected) is evenly distributed. However, it’s not a zero as it was in the testing with the idle server, because the server’s keepalive_requests are configured to 300, and we see FINs followed by SYN/ACKs; we didn’t see that as often in the previous tests, when keepalive_requests were set to a higher value. But given the amount of siege runs, we see the 95 percentile and the 50 percentile (median) time is 0, which saves client and server resources on the SYN/ACK handshake and the TLS exchange.
With client keepalive used to connect to a heavily loaded backend located far away, the throughput jumps nearly five times: the nginx.upstream.request.count increased from 370 to 1731 requests per minute.

For both nginx.upstream.connect.time and nginx.upstream.header.time, the values of 95 percentile and 50 percentile are equal when using keepalive. It’s a very interesting fact, which can possibly be interpreted this way: by reducing the round-trip time (RTT) we have less connection overhead, and that provides more consistent response time.
The Wireshark TCP streams analysis is very similar to that of the idle server:
A: upstream: close, proxy_pass_connection: close (gist here)

B: upstream: keepalive, proxy_pass_connection: keepalive (gist here)

The I/O graph looks similar, too:

As an extra benefit, in a situation where you have more than one upstream backend server, you can use the least_time directive to avoid querying the slower origin server.
Key Findings
To summarize our findings from this testing effort:
- TCP Congestion window and bytes in flights can be increased by using TCP keepalive; the factor depends on round-trip time. For EU West (client) -> US West (origin), performance at least doubles.
- The NGINX upstream keepalive mechanism reduces connection overhead – in a nutshell, there are fewer TCP/IP packet round trips – and also gives consistent response time. Using NGINX Amplify helps visualize this in a no-hassle manner.
- NGINX Amplify serves as a powerful tool that helps to identify bottlenecks and to troubleshoot excessive TCP connect time, which would otherwise affect application performance.
The post Troubleshooting Application Performance and Slow TCP Connections with NGINX Amplify appeared first on NGINX.
Source: Troubleshooting Application Performance and Slow TCP Connections with NGINX Amplify


Leave a Reply