The Mission-Critical Patient-Care Use Case That Became a Kubernetes Odyssey

Downtime can lead to serious consequences.
These words are truer for companies in the medical technology field than in most other industries – in their case, the "serious consequences" can literally include death. We recently had the chance to dissect the tech stack of a company that’s seeking to transform medical record keeping from pen-and-paper to secure digital data that is accessible anytime, and anywhere, in the world. These data range from patient information to care directives, biological markers, medical analytics, historical records, and everything else shared between healthcare teams.
From the outset, the company has sought to address a seemingly simple question: “How can we help care workers easily record data in real time?” As the company has grown, however, the need to scale and make data constantly available has made solving that challenge increasingly complex. Here we describe how the company’s tech journey has led them to adopt Kubernetes and NGINX Ingress Controller.
Tech Stack at a Glance
- OS – Linux
- Container orchestration – Microsoft Azure Kubernetes Service
- Networking – Kubernetes, NGINX Ingress Controller based on NGINX Plus
- Software development language/framework – .Net
- Monitoring, observability, and Alerting – Prometheus
- Monitoring dashboard – Grafana
- Logging – Grafana Loki
- Database – Azure SQL Service
- Application server – Azure App Service, .Net
- Messaging and streaming– Azure Event Hubs
- Caching – Redis
- Security – NGINX App Protect
- Location and infrastructure – Two availability zones, 2 Kubernetes clusters, 15–20 nodes, 60–100 pods
- DevOps – Azure DevOps Services
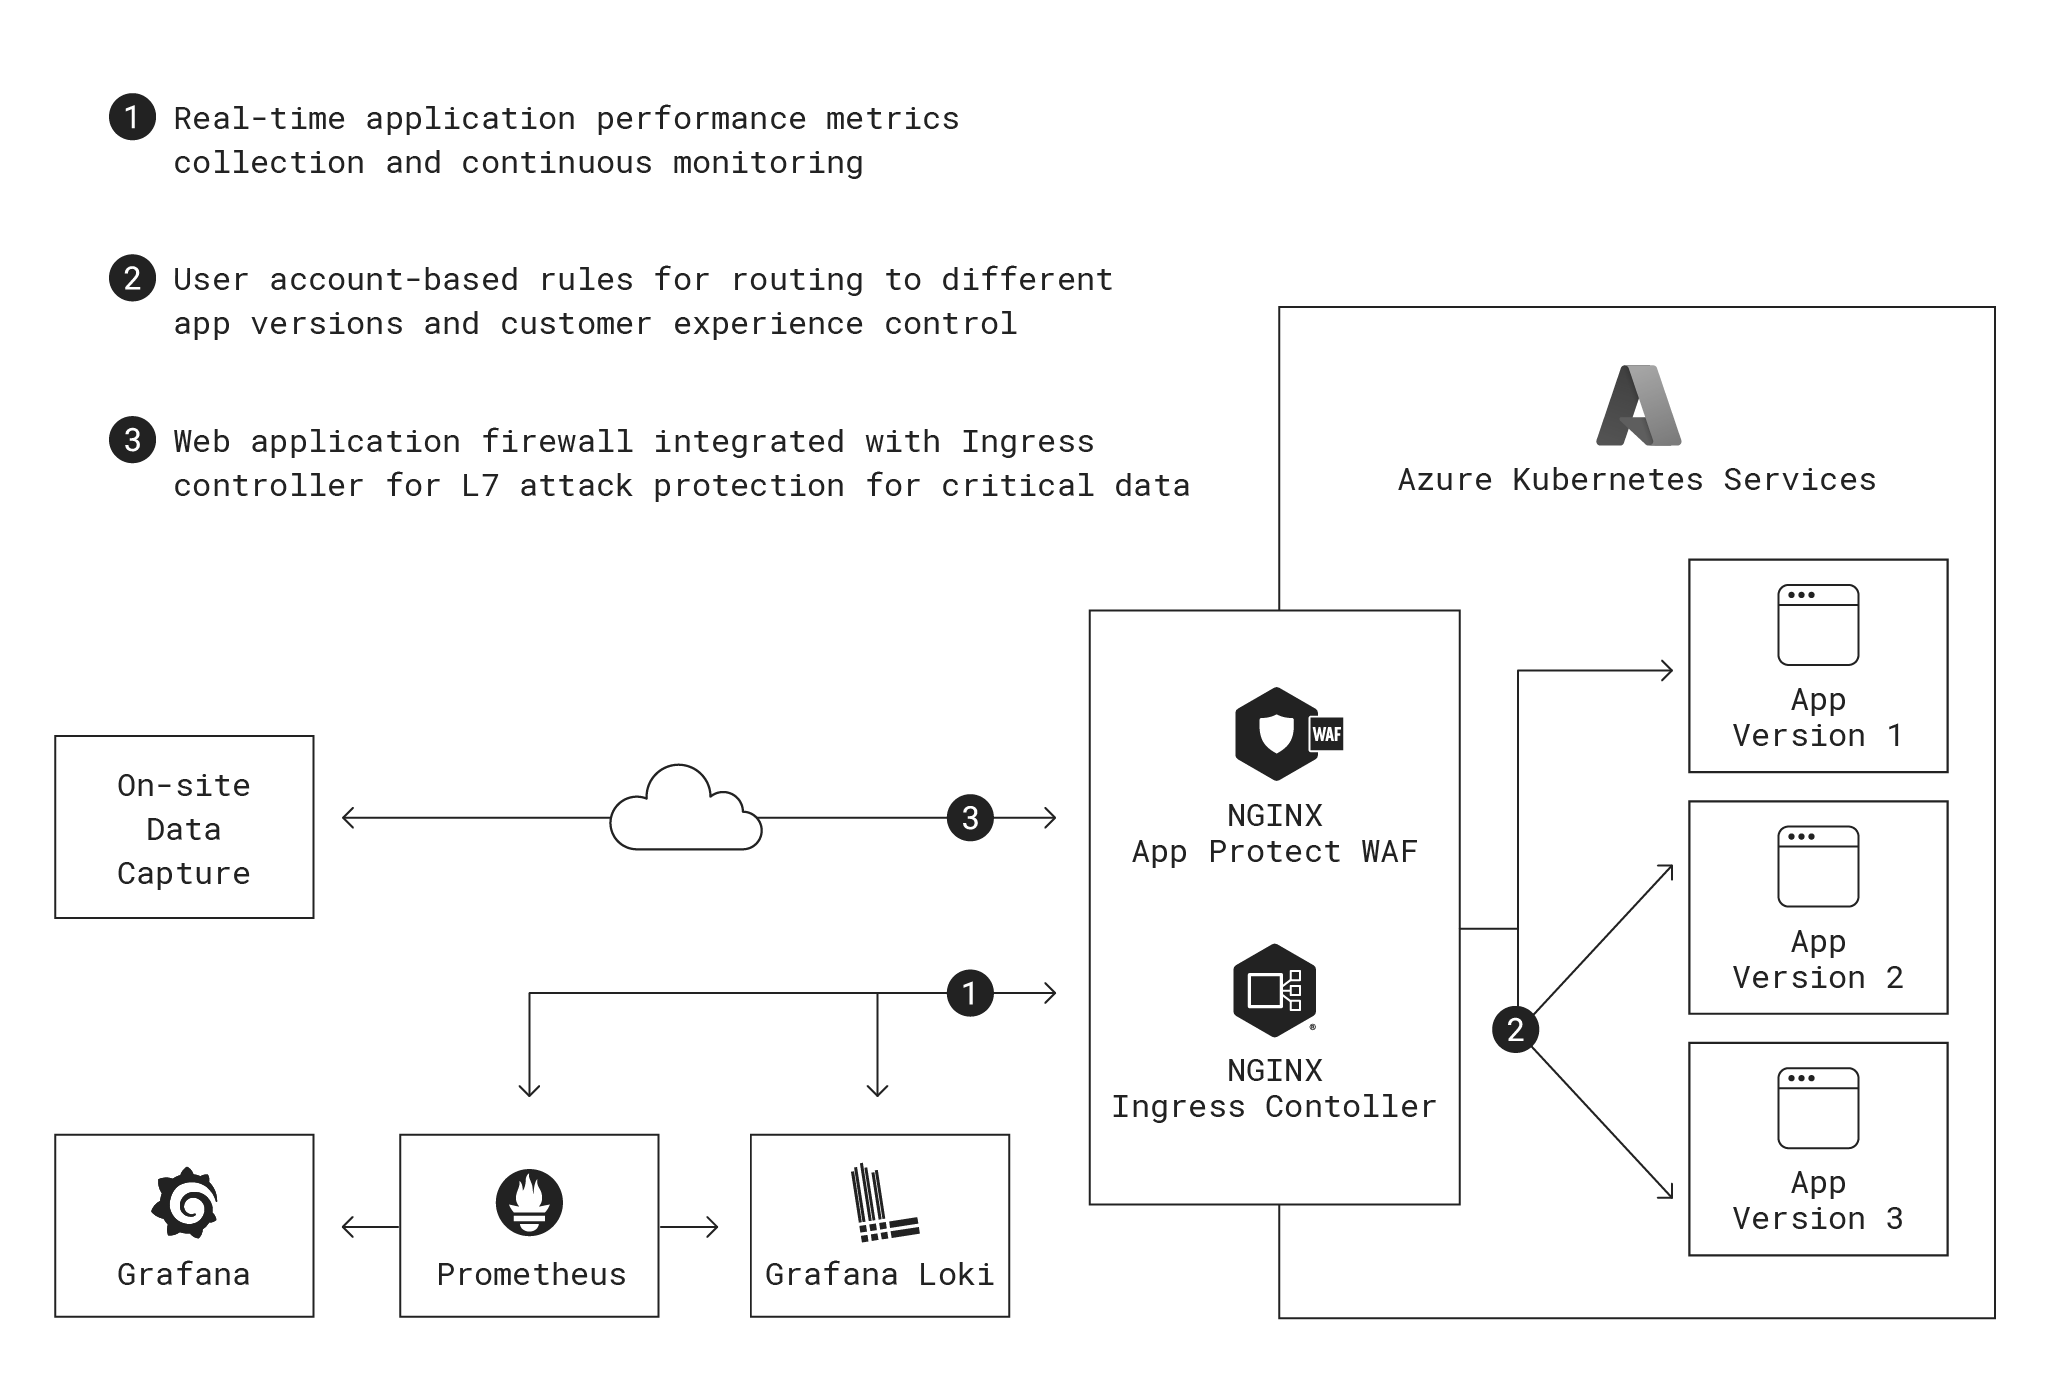
Here’s a look at where NGINX fits into their architecture:
The Problem with Paper
Capturing patient status and care information at regular intervals is a core duty for healthcare personnel. Traditionally, they have recorded patient information on paper, or more recently on laptop or tablet. There are a couple serious downsides:
- Healthcare workers may interact dozens of patients per day, so it’s usually not practical to write detailed notes while providing care. As a result, workers end up writing their notes at the end of their shift. At that point, mental and physical fatigue make it tempting to record only generic comments.
- The workers must also depend on their memory of details about patient behavior. Inaccuracies might mask patterns that facilitate diagnosis of larger health issues if documented correctly and consistently over time.
- Paper records can’t easily be shared among departments within a single department, let alone with other entities like EMTs, emergency room staff, and insurance companies. The situation isn’t much better with laptops or tablets if they’re not connected to a central data store or the cloud.
To address these challenges, the company created a simplified data recording system that provides shortcuts for accessing patient information and recording common events like dispensing medication. This ease of access and use makes it possible to record patient interactions in real time as they happen.
All data is stored in cloud systems maintained by the company, and the app integrates with other electronic medical records systems to provide a comprehensive longitudinal view of resident behaviors. This helps caregivers provide better continuity of care, creates a secure historical record, and can be easily shared with other healthcare software systems.
Physicians and other specialists also use the platform when admitting or otherwise engaging with patients. There’s a record of preferences and personal needs that travel with the patient to any facility. These can be used to help patients feel comfortable in a new setting, which improve outcomes like recovery time.
There are strict legal requirements about how long companies must store patient data. The company’s developers have built the software to offer extremely high availability with uptime SLAs that are much better than those of generic cloud applications. Keeping an ambulance waiting because a patient’s file won’t load isn’t an option.
The Voyage from the Garage to the Cloud to Kubernetes
Like many startups, the company initially saved money by running the first proof-of-concept application on a server in a co-founder’s home. Once it became clear the idea had legs, the company moved its infrastructure to the cloud rather than manage hardware in a data center. Being a Microsoft shop, they chose Azure. The initial architecture ran applications on traditional virtual machines (VMs) in Azure App Service, a managed application delivery service that runs Microsoft’s IIS web server. For data storage and retrieval, the company opted to use Microsoft’s SQL Server running in a VM as a managed application.
After several years running in the cloud, the company was growing quickly and experiencing scaling pains. It needed to scale infinitely, and horizontally rather than vertically because the latter is slow and expensive with VMs. This requirement led rather naturally to containerization and Kubernetes as a possible solution. A further point in favor of containerization was that the company’s developers need to ship updates to the application and infrastructure frequently, without risking outages. With patient notes being constantly added across multiple time zones, there is no natural downtime to push changes to production without the risk of customers immediately being affected by glitches.
A logical starting point for the company was Microsoft’s managed Kubernetes offering, Azure Kubernetes Services (AKS). The team researched Kubernetes best practices and realized they needed an running in front of their Kubernetes clusters to effectively manage traffic and applications running in nodes and pods on AKS.
Traffic Routing Must Be Flexible Yet Precise
The team tested AKS’s default Ingress controller, but found its traffic-routing features simply could not deliver updates to the company’s customers in the required manner. When it comes to patient care, there’s no room for ambiguity or conflicting information – it’s unacceptable for one care worker to see an orange flag and another a red flag for the same event, for example. Hence, all users in a given organization must use the same version of the app. This presents a big challenge when it comes to upgrades. There’s no natural time to transition a customer to a new version, so the company needed a way to use rules at the server and network level to route different customers to different app versions.
To achieve this, the company runs the same backend platform for all users in an organization and does not offer multi-tenancy with segmentation at the infrastructure layer within the organization. With Kubernetes, it is possible to split traffic using virtual network routes and cookies on browsers along with detailed traffic rules. However, the company’s technical team found that AKS’s default Ingress controller can split traffic only on a percentage basis, not with rules that operate at level of customer organization or individual user as required.
In its basic configuration, the NGINX Ingress Controller based on NGINX Open Source has the same limitation, so the company decided to pivot to the more advanced NGINX Ingress Controller based on NGINX Plus, an enterprise-grade product which supports granular traffic control. Finding recommendations from NGINX Ingress Controller from Microsoft and the Kubernetes community based on the high level of flexibility and control helped solidify the choice. The configuration better supports the company’s need for pod management (as opposed to classic traffic management), ensuring that pods are running in the appropriate zones and traffic is routed to those services. Sometimes traffic is being routed internally but in most use cases, it is routed back out through NGINX Ingress Controller for observability reasons.
Here Be Dragons: Monitoring, Observability and Application Performance
With NGINX Ingress Controller, the technical team has complete control over the developer and end user experience. Once users log in and establish a session, they can immediately be routed to a new version or reverted back to an older one. Patches can be pushed simultaneously and nearly instantaneously to all users in an organization. The software isn’t reliant on DNS propagation or updates on networking across the cloud platform.
NGINX Ingress Controller also meets the company’s requirement for granular and continuous monitoring. Application performance is extremely important in healthcare. Latency or downtime can hamper successful clinical care, especially in life-or-death situations. After the move to Kubernetes, customers started reporting downtime that the company hadn’t noticed. The company soon discovered the source of the problem: Azure App Service relies on sampled data. Sampling is fine for averages and broad trends, but it completely misses things like rejected requests and missing resources. Nor does it show the usage spikes that commonly occur every half hour as care givers check in and log patient data. The company was getting only an incomplete picture of latency, error sources, bad requests, and unavailable service.
The problems didn’t stop there. By default Azure App Service preserves stored data for only a month – far short of the dozens of years mandated by laws in many countries. Expanding the data store as required for longer preservation was prohibitively expensive. In addition, the Azure solution cannot see inside of the Kubernetes networking stack. NGINX Ingress Controller can monitor both infrastructure and application parameters as it handles Layer 4 and Layer 7 traffic.
For performance monitoring and observability, the company chose a Prometheus time-series database attached to a Grafana visualization engine and dashboard. Integration with Prometheus and Grafana is pre-baked into the NGINX data and control plane; the technical team had to make only a small configuration change to direct all traffic through the Prometheus and Grafana servers. The information was also routed into a Grafana Loki logging database to make it easier to analyze logs and give the software team more control over data over time.
This configuration also future-proofs against incidents requiring extremely frequent and high-volume data sampling for troubleshooting and fixing bugs. Addressing these types of incidents might be costly with the application monitoring systems provided by most large cloud companies, but the cost and overhead of Prometheus, Grafana, and Loki in this use case are minimal. All three are stable open source products which generally require little more than patching after initial tuning.
Stay the Course: A Focus on High Availability and Security
The company has always had a dual focus, on security to protect one of the most sensitive types of data there is, and on high availability to ensure the app is available whenever it’s needed. In the shift to Kubernetes, they made a few changes to augment both capacities.
For the highest availability, the technical team deploys an active-active, multi-zone, and multi-geo distributed infrastructure design for complete redundancy with no single point of failure. The team maintains N+2 active-active infrastructure with dual Kubernetes clusters in two different geographies. Within each geography, the software spans multiple data centers to reduce downtime risk, providing coverage in case of any failures at any layer in the infrastructure. Affinity and anti-affinity rules can instantly reroute users and traffic to up-and-running pods to prevent service interruptions.
For security, the team deploys a web application firewall (WAF) to guard against bad requests and malicious actors. Protection against the OWASP Top 10 is table stakes provided by most WAFs. As they created the app, the team researched a number of WAFs including the native Azure WAF and ModSecurity. In the end, the team chose NGINX App Protect with its inline WAF and distributed denial-of-service (DDoS) protection.
A big advantage of NGINX App Protect is its colocation with NGINX Ingress Controller, which both eliminates a point of redundancy and reduces latency. Other WAFs must be placed outside of the Kubernetes environment, contributing to latency and cost. Even miniscule delays (say 1 millisecond extra per request) add up quickly over time.
Surprise Side Quest: No Downtime for Developers
Having completed the transition to AKS for most of its application and networking infrastructure, the company has also realized significant improvements to its developer experience (DevEx). Developers now almost always spot problems before customers notice any issues themselves. Since the switch, the volume of support calls about errors is down about 80%!
The company’s security and application-performance teams have a detailed Grafana dashboard and unified alerting, eliminating the need to check multiple systems or implement triggers for warning texts and calls coming from different processes. The development and DevOps teams can now ship code and infrastructure updates daily or even multiple times per day and use extremely granular blue-green patterns. Formerly, they were shipping updates once or twice per week and having to time there for low-usage windows, a stressful proposition. Now, code is shipped when ready and the developers can monitor the impact directly by observing application behavior.
The results are positive all around – an increase in software development velocity, improvement in developer morale, and more lives saved.
The post The Mission-Critical Patient-Care Use Case That Became a Kubernetes Odyssey appeared first on NGINX.
Source: The Mission-Critical Patient-Care Use Case That Became a Kubernetes Odyssey


Leave a Reply